
 21.01.2022 05:27 AM
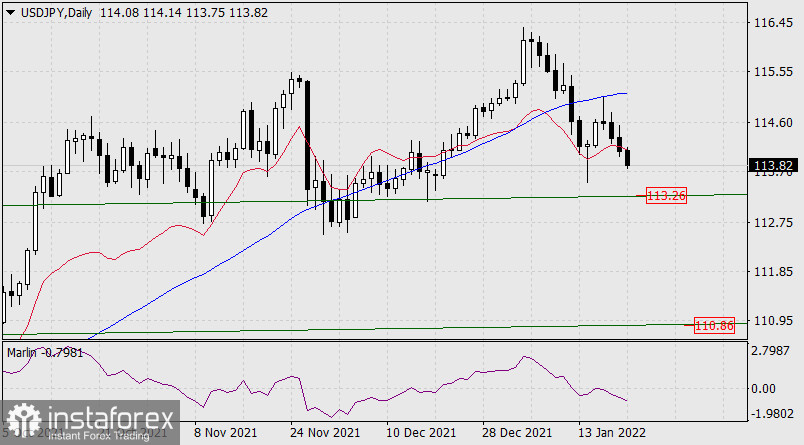
The USD/JPY pair continues to develop a downward movement towards the 113.26 target - to the line of the price channel of the monthly timeframe. The movement is intensified by a technical sign - the price moving below the red balance indicator line and the external market - the fall of stock indices: yesterday the S&P 500 fell by 1.10%, this morning the Japanese Nikkei 225 is losing 1.40%. Consolidating under 113.26 will lead the pair to an even deeper decline, to the next price channel line in the area of 110.86.
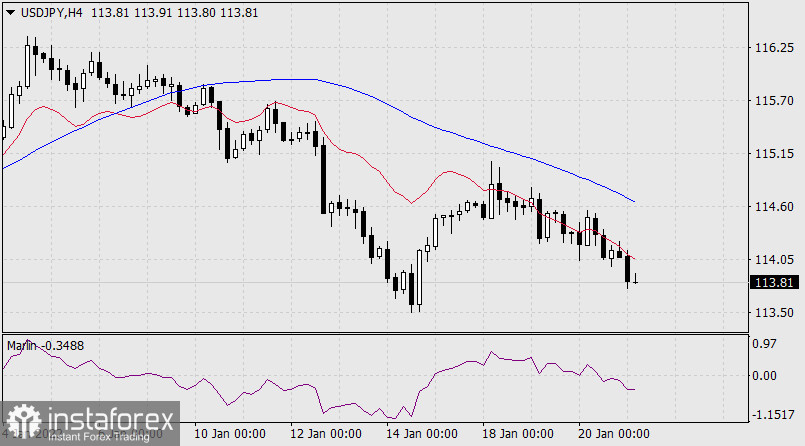
On the four-hour chart, the price starts to move down from the balance indicator line, while the Marlin Oscillator deepens into the bears' territory. We are waiting for a further decline to the designated target.
You have already liked this post today
*这里的市场分析是为了增加您对市场的了解,而不是给出交易的指示。


