Тройная вершина
сформирован 24.03 в 14:29:45 (UTC+0)
сила сигнала 3 из 5

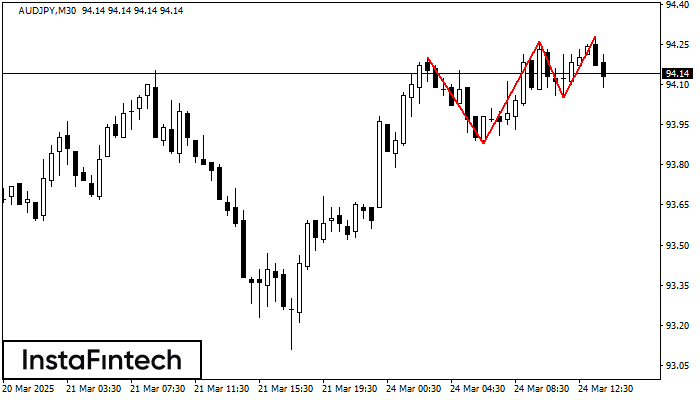
На графике AUDJPY M30 образовалась фигура «Тройная вершина». Данная фигура относится к типу разворотных и имеет характеристику: Верхняя граница 94.20/94.28; Нижняя граница 93.88/94.05; Ширина фигуры 21 пунктов. Прогноз: В случае пробоя нижней границы 93.88 вероятно дальнейшее нисходящее движение к уровню 93.96.
Шунингдек кўринг
- Все
- Все
- Bearish Rectangle
- Bearish Symmetrical Triangle
- Bullish Rectangle
- Double Top
- Double Top
- Triple Bottom
- Triple Bottom
- Triple Top
- Triple Top
- Все
- Все
- Покупка
- Продажа
- Все
- 1
- 2
- 3
- 4
- 5
Double Bottom
was formed on 14.06 at 21:00:24 (UTC+0)
signal strength 1 of 5
The Double Bottom pattern has been formed on #Bitcoin M5. Characteristics: the support level 104299.16; the resistance level 104939.96; the width of the pattern 64080 points. If the resistance level
The M5 and M15 time frames may have more false entry points.
Open chart in a new window
Double Bottom
was formed on 14.06 at 15:14:48 (UTC+0)
signal strength 2 of 5
The Double Bottom pattern has been formed on #Bitcoin M15. Characteristics: the support level 104607.76; the resistance level 106173.71; the width of the pattern 156595 points. If the resistance level
The M5 and M15 time frames may have more false entry points.
Open chart in a new window
Triple Bottom
was formed on 13.06 at 22:45:28 (UTC+0)
signal strength 1 of 5
The Triple Bottom pattern has formed on the chart of AUDCHF M5. Features of the pattern: The lower line of the pattern has coordinates 0.5269 with the upper limit 0.5269/0.5268
The M5 and M15 time frames may have more false entry points.
Open chart in a new window