Тройное дно
сформирован 11.04 в 15:45:01 (UTC+0)
сила сигнала 2 из 5

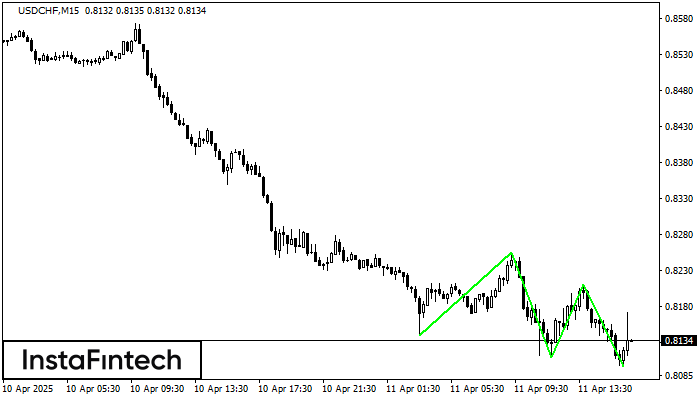
Сформирована фигура «Тройное дно» по торговому инструменту USDCHF на M15. Фигура сигнализирует об изменении тенденции с нисходящей на восходящую в случае пробоя верхней границы 0.8211.
Таймфреймы М5 и М15 могут иметь больше ложных точек входа.
- Все
- Все
- Bearish Rectangle
- Bearish Symmetrical Triangle
- Bullish Rectangle
- Double Top
- Double Top
- Triple Bottom
- Triple Bottom
- Triple Top
- Triple Top
- Все
- Все
- Покупка
- Продажа
- Все
- 1
- 2
- 3
- 4
- 5
Bearish Symmetrical Triangle
was formed on 04.07 at 13:30:29 (UTC+0)
signal strength 2 of 5
According to the chart of M15, NZDCHF formed the Bearish Symmetrical Triangle pattern. Trading recommendations: A breach of the lower border 0.4804 is likely to encourage a continuation
The M5 and M15 time frames may have more false entry points.
Open chart in a new window
Double Bottom
was formed on 04.07 at 13:05:19 (UTC+0)
signal strength 1 of 5
The Double Bottom pattern has been formed on GBPJPY M5. Characteristics: the support level 196.96; the resistance level 197.12; the width of the pattern 16 points. If the resistance level
The M5 and M15 time frames may have more false entry points.
Open chart in a new window
Bearish Symmetrical Triangle
was formed on 04.07 at 12:51:00 (UTC+0)
signal strength 1 of 5
According to the chart of M5, NZDCHF formed the Bearish Symmetrical Triangle pattern. This pattern signals a further downward trend in case the lower border 0.4804 is breached. Here
The M5 and M15 time frames may have more false entry points.
Open chart in a new window