Медвежий вымпел
сформирован 21.04 в 17:59:42 (UTC+0)
сила сигнала 3 из 5

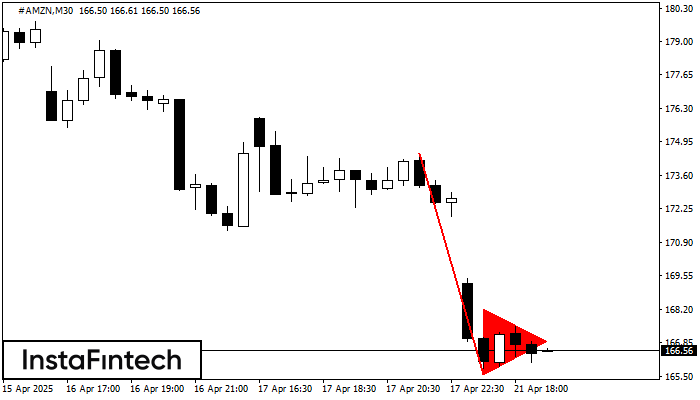
По торговому инструменту #AMZN на M30 сформировалась графическая фигура «Медвежий вымпел». Фигура данного типа характеризует небольшое замедление, после которого движение продолжится в исходном тренде. В случае если котировке удастся зафиксироваться ниже минимума образованной фигуры 165.57, трейдеру представится возможность удачно войти в позицию на продажу.
Шунингдек кўринг
- Все
- Все
- Bearish Rectangle
- Bearish Symmetrical Triangle
- Bullish Rectangle
- Double Top
- Double Top
- Triple Bottom
- Triple Bottom
- Triple Top
- Triple Top
- Все
- Все
- Покупка
- Продажа
- Все
- 1
- 2
- 3
- 4
- 5
Bullish Rectangle
was formed on 11.06 at 09:09:55 (UTC+0)
signal strength 1 of 5
According to the chart of M5, USDCAD formed the Bullish Rectangle which is a pattern of a trend continuation. The pattern is contained within the following borders: the lower border
The M5 and M15 time frames may have more false entry points.
Open chart in a new window
Bearish Rectangle
was formed on 11.06 at 08:00:03 (UTC+0)
signal strength 1 of 5
According to the chart of M5, NZDCAD formed the Bearish Rectangle. This type of a pattern indicates a trend continuation. It consists of two levels: resistance 0.8257 - 0.0000
The M5 and M15 time frames may have more false entry points.
Open chart in a new window
Triple Top
was formed on 11.06 at 07:15:24 (UTC+0)
signal strength 1 of 5
On the chart of the GOLD M5 trading instrument, the Triple Top pattern that signals a trend change has formed. It is possible that after formation of the third peak
The M5 and M15 time frames may have more false entry points.
Open chart in a new window