Тройная вершина
сформирован 09.05 в 12:14:47 (UTC+0)
сила сигнала 2 из 5

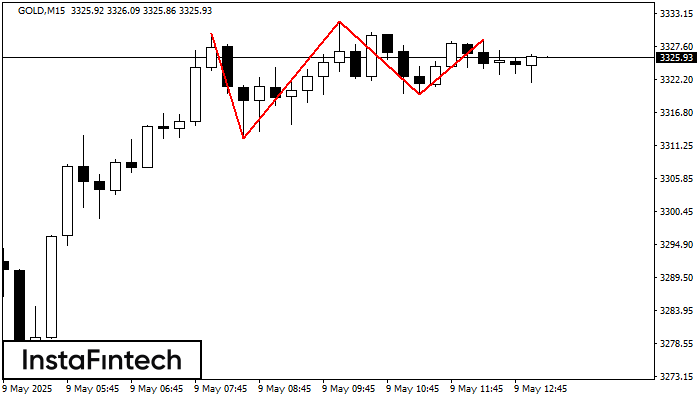
На графике GOLD M15 образовалась фигура «Тройная вершина». Данная фигура относится к типу разворотных и имеет характеристику: Верхняя граница 3329.82/3328.83; Нижняя граница 3312.44/3319.79; Ширина фигуры 1200 пунктов. Прогноз: В случае пробоя нижней границы 3312.44 вероятно дальнейшее нисходящее движение к уровню 3331.56.
Таймфреймы М5 и М15 могут иметь больше ложных точек входа.
- Все
- Все
- Bearish Rectangle
- Bearish Symmetrical Triangle
- Bullish Rectangle
- Double Top
- Double Top
- Triple Bottom
- Triple Bottom
- Triple Top
- Triple Top
- Все
- Все
- Покупка
- Продажа
- Все
- 1
- 2
- 3
- 4
- 5
Double Bottom
was formed on 04.07 at 07:34:53 (UTC+0)
signal strength 1 of 5
The Double Bottom pattern has been formed on #Bitcoin M5. Characteristics: the support level 108904.37; the resistance level 109120.02; the width of the pattern 21565 points. If the resistance level
The M5 and M15 time frames may have more false entry points.
Open chart in a new window
Double Top
was formed on 04.07 at 07:25:13 (UTC+0)
signal strength 1 of 5
The Double Top reversal pattern has been formed on GOLD M5. Characteristics: the upper boundary 3341.81; the lower boundary 3338.80; the width of the pattern is 293 points. Sell trades
The M5 and M15 time frames may have more false entry points.
Open chart in a new window
Bearish Symmetrical Triangle
was formed on 04.07 at 04:32:14 (UTC+0)
signal strength 1 of 5
According to the chart of M5, USDCAD formed the Bearish Symmetrical Triangle pattern. Description: The lower border is 1.3561/1.3576 and upper border is 1.3590/1.3576. The pattern width is measured
The M5 and M15 time frames may have more false entry points.
Open chart in a new window