Долзарб паттернлар

Бычий симметричный треугольник
сформирован 19.05 в 02:04:32 (UTC+0)
сила сигнала 1 из 5
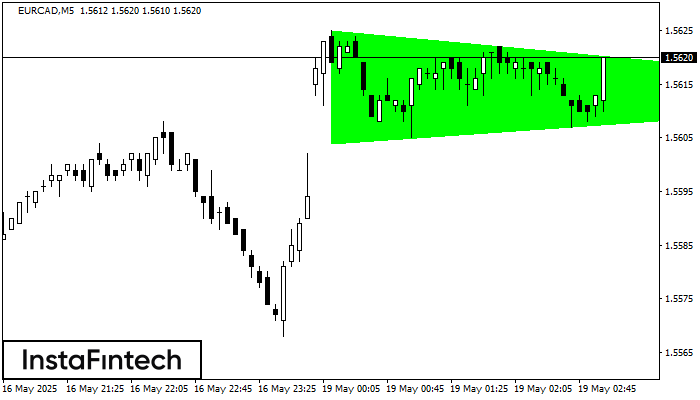
По EURCAD на M5 фигура «Бычий симметричный треугольник». Характеристика: Фигура продолжения тренда; Координаты границ – верхняя 1.5625, нижняя 1.5604. Проекция ширины фигуры 21 пунктов. Прогноз: В случае пробоя верхней границы 1.5625 цена, вероятнее всего, продолжит движение к 1.5628.
Таймфреймы М5 и М15 могут иметь больше ложных точек входа.
Шунингдек кўринг
- Все
- Все
- Bearish Rectangle
- Bearish Symmetrical Triangle
- Bearish Symmetrical Triangle
- Bullish Rectangle
- Double Top
- Double Top
- Triple Bottom
- Triple Bottom
- Triple Top
- Triple Top
- Все
- Все
- Покупка
- Продажа
- Все
- 1
- 2
- 3
- 4
- 5
Bullish Symmetrical Triangle
was formed on 14.11 at 19:36:04 (UTC+0)
signal strength 1 of 5
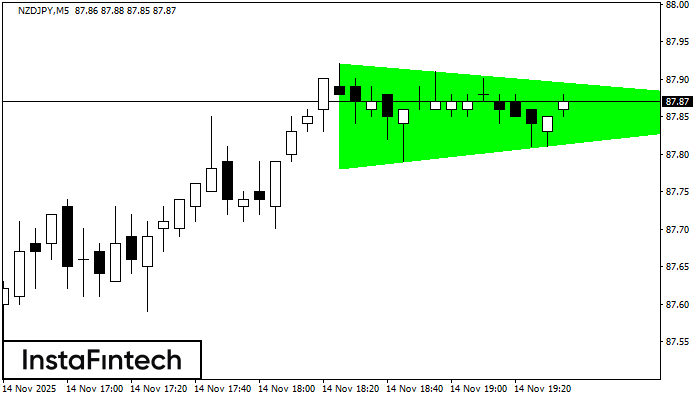
According to the chart of M5, NZDJPY formed the Bullish Symmetrical Triangle pattern, which signals the trend will continue. Description. The upper border of the pattern touches the coordinates 87.92/87.86
The M5 and M15 time frames may have more false entry points.
Open chart in a new window
Head and Shoulders
was formed on 14.11 at 19:15:41 (UTC+0)
signal strength 1 of 5
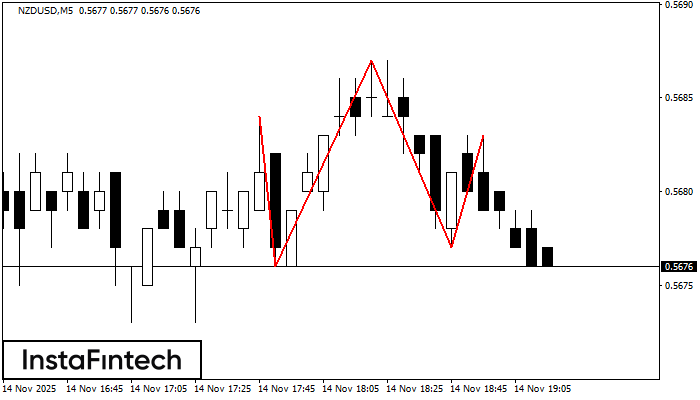
The NZDUSD M5 formed the Head and Shoulders pattern with the following features: The Head’s top is at 0.5687, the Neckline and the upward angle are at 0.5676/0.5677. The formation
The M5 and M15 time frames may have more false entry points.
Open chart in a new window
Double Top
was formed on 14.11 at 19:15:31 (UTC+0)
signal strength 1 of 5
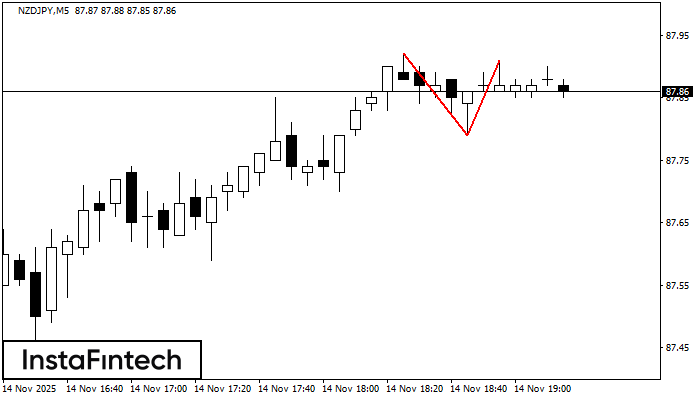
On the chart of NZDJPY M5 the Double Top reversal pattern has been formed. Characteristics: the upper boundary 87.91; the lower boundary 87.79; the width of the pattern 12 points
The M5 and M15 time frames may have more false entry points.
Open chart in a new window