Двойная вершина
сформирован 21.05 в 14:30:09 (UTC+0)
сила сигнала 3 из 5

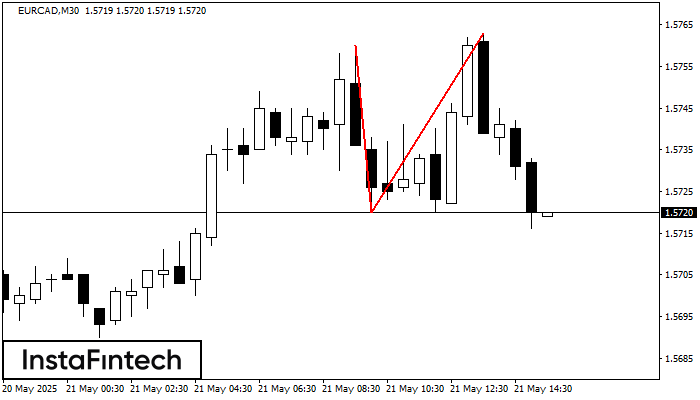
По торговому инструменту EURCAD на M30 сформировалась фигура «Двойная вершина», которая сигнализирует нам об изменении тенденции с восходящей на нисходящую. Вероятно, что, в случае пробоя основания фигуры 1.5720, возможно дальнейшее нисходящее движение.
Шунингдек кўринг
- Все
- Все
- Bearish Rectangle
- Bearish Symmetrical Triangle
- Bullish Rectangle
- Double Top
- Double Top
- Triple Bottom
- Triple Bottom
- Triple Top
- Triple Top
- Все
- Все
- Покупка
- Продажа
- Все
- 1
- 2
- 3
- 4
- 5
Bearish Rectangle
was formed on 03.07 at 07:04:22 (UTC+0)
signal strength 1 of 5
According to the chart of M5, SILVER formed the Bearish Rectangle which is a pattern of a trend continuation. The pattern is contained within the following borders: lower border 36.31
The M5 and M15 time frames may have more false entry points.
Open chart in a new window
Double Bottom
was formed on 03.07 at 07:01:02 (UTC+0)
signal strength 2 of 5
The Double Bottom pattern has been formed on AUDCAD M15; the upper boundary is 0.8929; the lower boundary is 0.8922. The width of the pattern is 8 points. In case
The M5 and M15 time frames may have more false entry points.
Open chart in a new window
Triple Bottom
was formed on 03.07 at 04:51:29 (UTC+0)
signal strength 1 of 5
The Triple Bottom pattern has formed on the chart of AUDJPY M5. Features of the pattern: The lower line of the pattern has coordinates 94.44 with the upper limit 94.44/94.36
The M5 and M15 time frames may have more false entry points.
Open chart in a new window