Двойная вершина
сформирован 04.06 в 10:00:01 (UTC+0)
сила сигнала 4 из 5

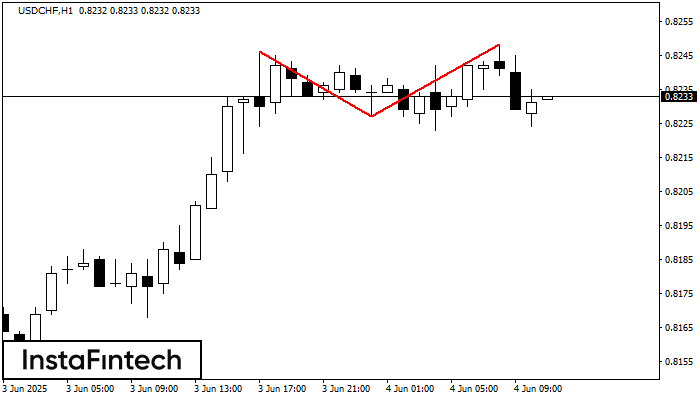
По USDCHF на H1 сформировалась разворотная фигура «Двойная вершина». Характеристика: Верхняя граница 0.8246; Нижняя граница 0.8227; Ширина фигуры 21 пунктов. Позицию на продажу возможно открыть ниже нижней границы 0.8227, с перспективой хода к уровню 0.8187.
Шунингдек кўринг
- Все
- Все
- Bearish Rectangle
- Bearish Symmetrical Triangle
- Bullish Rectangle
- Double Top
- Double Top
- Triple Bottom
- Triple Bottom
- Triple Top
- Triple Top
- Все
- Все
- Покупка
- Продажа
- Все
- 1
- 2
- 3
- 4
- 5
Bearish Symmetrical Triangle
was formed on 19.08 at 03:55:59 (UTC+0)
signal strength 1 of 5
According to the chart of M5, NZDCAD formed the Bearish Symmetrical Triangle pattern. Description: The lower border is 0.8164/0.8175 and upper border is 0.8190/0.8175. The pattern width is measured
The M5 and M15 time frames may have more false entry points.
Open chart in a new window
Double Bottom
was formed on 19.08 at 03:00:49 (UTC+0)
signal strength 4 of 5
The Double Bottom pattern has been formed on AUDCAD H1; the upper boundary is 0.9000; the lower boundary is 0.8952. The width of the pattern is 50 points. In case
Open chart in a new window
Bullish Rectangle
was formed on 19.08 at 00:09:48 (UTC+0)
signal strength 1 of 5
According to the chart of M5, AUDJPY formed the Bullish Rectangle. The pattern indicates a trend continuation. The upper border is 95.99, the lower border is 95.89. The signal means
The M5 and M15 time frames may have more false entry points.
Open chart in a new window