Тройное дно
сформирован 11.06 в 05:00:31 (UTC+0)
сила сигнала 1 из 5

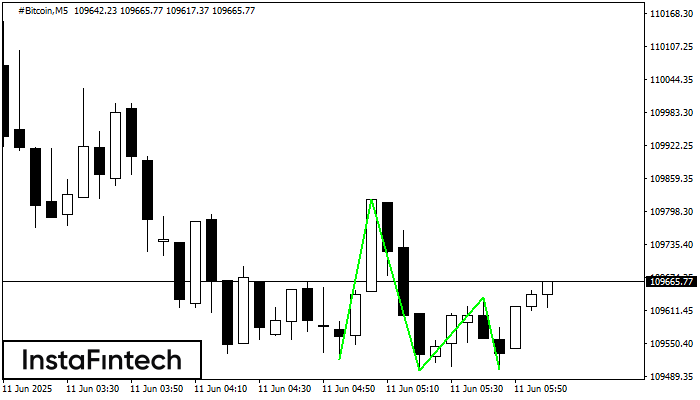
По торговому инструменту #Bitcoin на M5 была сформирована графическая фигура «Тройное дно» с характеристиками: Уровень сопротивления 109636.18; Уровень поддержки 109502.23; Ширина 13395 пунктов. В случае пробоя уровня сопротивления 109821.12 котировка, скорее всего, продолжит восходящее движение как минимум на 32090 пунктов.
Таймфреймы М5 и М15 могут иметь больше ложных точек входа.
Шунингдек кўринг
- Все
- Все
- Bearish Rectangle
- Bearish Symmetrical Triangle
- Bullish Rectangle
- Double Top
- Double Top
- Triple Bottom
- Triple Bottom
- Triple Top
- Triple Top
- Все
- Все
- Покупка
- Продажа
- Все
- 1
- 2
- 3
- 4
- 5
Bearish Rectangle
was formed on 09.07 at 18:50:04 (UTC+0)
signal strength 1 of 5
According to the chart of M5, #PEP formed the Bearish Rectangle. This type of a pattern indicates a trend continuation. It consists of two levels: resistance 133.83 - 0.00
The M5 and M15 time frames may have more false entry points.
Open chart in a new window
Bearish Rectangle
was formed on 09.07 at 18:50:02 (UTC+0)
signal strength 1 of 5
According to the chart of M5, #PEP formed the Bearish Rectangle. The pattern indicates a trend continuation. The upper border is 133.83, the lower border is 132.94. The signal means
The M5 and M15 time frames may have more false entry points.
Open chart in a new window
Triple Bottom
was formed on 09.07 at 18:20:21 (UTC+0)
signal strength 1 of 5
The Triple Bottom pattern has formed on the chart of #TSLA M5. Features of the pattern: The lower line of the pattern has coordinates 299.81 with the upper limit 299.81/296.14
The M5 and M15 time frames may have more false entry points.
Open chart in a new window