Прямоугольник
сформирован 11.06 в 09:09:55 (UTC+0)
сила сигнала 1 из 5

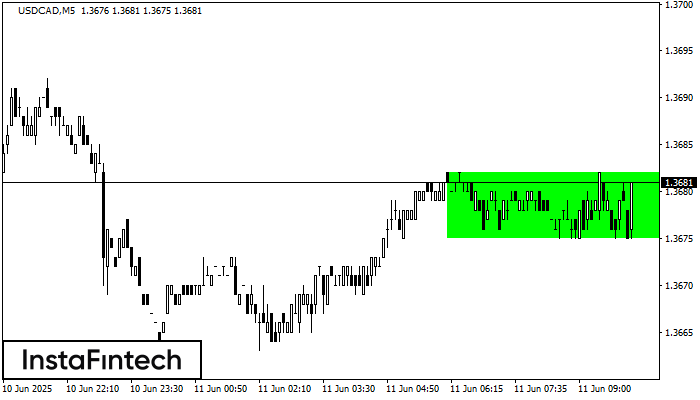
По торговому инструменту USDCAD на M5 сформировалась фигура продолжения тренда - «Прямоугольник». Фигура имеет границы: Нижняя 1.3675; Верхняя 1.3682. В случае пробоя верхней границы вероятно дальнейшее движение в сторону тренда.
Таймфреймы М5 и М15 могут иметь больше ложных точек входа.
Шунингдек кўринг
- Все
- Все
- Bearish Rectangle
- Bearish Symmetrical Triangle
- Bullish Rectangle
- Double Top
- Double Top
- Triple Bottom
- Triple Bottom
- Triple Top
- Triple Top
- Все
- Все
- Покупка
- Продажа
- Все
- 1
- 2
- 3
- 4
- 5
Head and Shoulders
was formed on 23.07 at 21:36:38 (UTC+0)
signal strength 1 of 5
The technical pattern called Head and Shoulders has appeared on the chart of #NTDOY M5. There are weighty reasons to suggest that the price will surpass the Neckline 22.12/22.12 after
The M5 and M15 time frames may have more false entry points.
Open chart in a new window
Head and Shoulders
was formed on 23.07 at 21:36:33 (UTC+0)
signal strength 1 of 5
The #NTDOY M5 formed the Head and Shoulders pattern with the following features: The Head’s top is at 22.21, the Neckline and the upward angle are at 22.12/22.12. The formation
The M5 and M15 time frames may have more false entry points.
Open chart in a new window
Bullish Rectangle
was formed on 23.07 at 20:33:19 (UTC+0)
signal strength 3 of 5
According to the chart of M30, #TSLA formed the Bullish Rectangle which is a pattern of a trend continuation. The pattern is contained within the following borders: the lower border
Open chart in a new window