Двойное дно
сформирован 12.06 в 14:44:57 (UTC+0)
сила сигнала 2 из 5

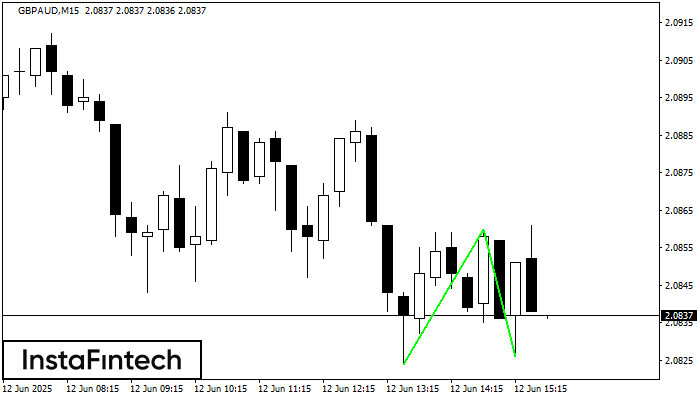
Сформирована фигура «Двойное дно» на графике GBPAUD M15. Данное формирование сигнализирует об изменении тенденции с нисходящего на восходящее движение. Сигнал: Торговую позицию на покупку следует открывать после пробоя верхней границы фигуры 2.0860, где перспектива будущего хода будет являться шириной текущей фигуры - 36 пунктов.
Таймфреймы М5 и М15 могут иметь больше ложных точек входа.
Шунингдек кўринг
- Все
- Все
- Bearish Rectangle
- Bearish Symmetrical Triangle
- Bullish Rectangle
- Double Top
- Double Top
- Triple Bottom
- Triple Bottom
- Triple Top
- Triple Top
- Все
- Все
- Покупка
- Продажа
- Все
- 1
- 2
- 3
- 4
- 5
Double Bottom
was formed on 04.07 at 10:50:34 (UTC+0)
signal strength 1 of 5
The Double Bottom pattern has been formed on GBPUSD M5; the upper boundary is 1.3666; the lower boundary is 1.3656. The width of the pattern is 10 points. In case
The M5 and M15 time frames may have more false entry points.
Open chart in a new window
Double Bottom
was formed on 04.07 at 08:25:18 (UTC+0)
signal strength 1 of 5
The Double Bottom pattern has been formed on NZDJPY M5. Characteristics: the support level 87.53; the resistance level 87.71; the width of the pattern 18 points. If the resistance level
The M5 and M15 time frames may have more false entry points.
Open chart in a new window
Double Bottom
was formed on 04.07 at 07:34:53 (UTC+0)
signal strength 1 of 5
The Double Bottom pattern has been formed on #Bitcoin M5. Characteristics: the support level 108904.37; the resistance level 109120.02; the width of the pattern 21565 points. If the resistance level
The M5 and M15 time frames may have more false entry points.
Open chart in a new window