Прямоугольник
сформирован 12.06 в 22:26:20 (UTC+0)
сила сигнала 1 из 5

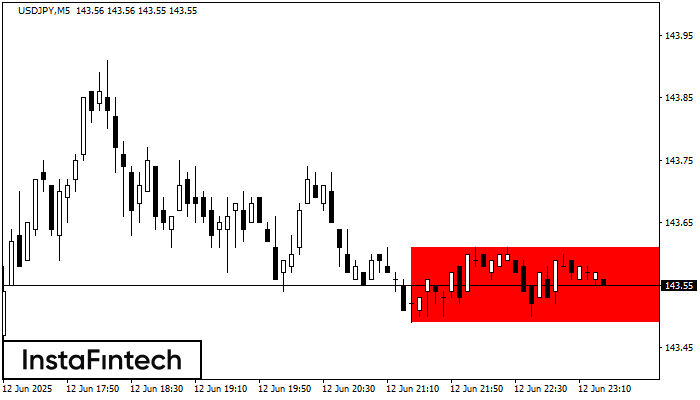
Сформирована фигура «Прямоугольник» на графике USDJPY M5. Тип фигуры: Продолжение тренда; Границы: Верхняя 143.61, Нижняя 143.49; Сигнал: позиция на продажу открывается после фиксации цены ниже границы прямоугольника 143.49.
Таймфреймы М5 и М15 могут иметь больше ложных точек входа.
- Все
- Все
- Bearish Rectangle
- Bearish Symmetrical Triangle
- Bullish Rectangle
- Double Top
- Double Top
- Triple Bottom
- Triple Bottom
- Triple Top
- Triple Top
- Все
- Все
- Покупка
- Продажа
- Все
- 1
- 2
- 3
- 4
- 5
Head and Shoulders
was formed on 28.08 at 09:15:41 (UTC+0)
signal strength 2 of 5
The GBPUSD M15 formed the Head and Shoulders pattern with the following features: The Head’s top is at 1.3517, the Neckline and the upward angle are at 1.3500/1.3499. The formation
The M5 and M15 time frames may have more false entry points.
Open chart in a new window
Bullish Symmetrical Triangle
was formed on 28.08 at 09:00:33 (UTC+0)
signal strength 1 of 5
According to the chart of M5, AUDCHF formed the Bullish Symmetrical Triangle pattern, which signals the trend will continue. Description. The upper border of the pattern touches the coordinates 0.5224/0.5221
The M5 and M15 time frames may have more false entry points.
Open chart in a new window
Bearish Rectangle
was formed on 28.08 at 08:17:27 (UTC+0)
signal strength 2 of 5
According to the chart of M15, GBPAUD formed the Bearish Rectangle. This type of a pattern indicates a trend continuation. It consists of two levels: resistance 2.0749 - 0.0000
The M5 and M15 time frames may have more false entry points.
Open chart in a new window