Двойное дно
сформирован 13.06 в 08:15:20 (UTC+0)
сила сигнала 2 из 5

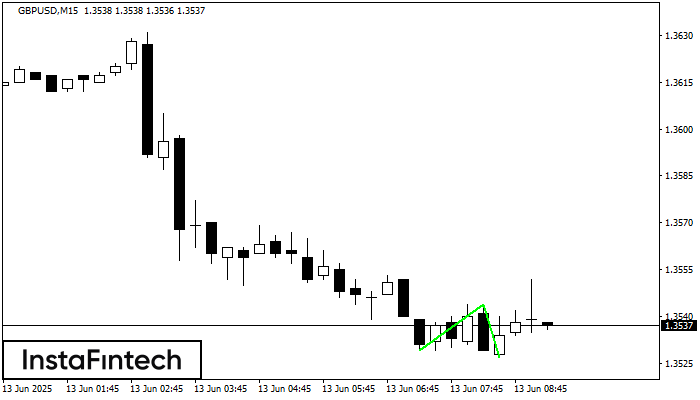
Сформирована фигура «Двойное дно» на графике GBPUSD M15. Характеристика: Уровень поддержки 1.3529; Уровень сопротивления 1.3544; Ширина фигуры 15 пунктов. В случае пробоя уровня сопротивления можно будет прогнозировать изменение тенденции, где первая точка фиксации прибыли находится на расстоянии 17 пунктов.
Таймфреймы М5 и М15 могут иметь больше ложных точек входа.
- Все
- Все
- Bearish Rectangle
- Bearish Symmetrical Triangle
- Bullish Rectangle
- Double Top
- Double Top
- Triple Bottom
- Triple Bottom
- Triple Top
- Triple Top
- Все
- Все
- Покупка
- Продажа
- Все
- 1
- 2
- 3
- 4
- 5
Double Bottom
was formed on 19.09 at 04:40:24 (UTC+0)
signal strength 1 of 5
The Double Bottom pattern has been formed on GBPCHF M5; the upper boundary is 1.0739; the lower boundary is 1.0731. The width of the pattern is 8 points. In case
The M5 and M15 time frames may have more false entry points.
Open chart in a new window
Triple Top
was formed on 19.09 at 01:30:38 (UTC+0)
signal strength 1 of 5
The Triple Top pattern has formed on the chart of the AUDJPY M5. Features of the pattern: borders have an ascending angle; the lower line of the pattern
The M5 and M15 time frames may have more false entry points.
Open chart in a new window
Triple Bottom
was formed on 19.09 at 00:31:35 (UTC+0)
signal strength 3 of 5
The Triple Bottom pattern has been formed on AUDUSD M30. It has the following characteristics: resistance level 0.6660/0.6624; support level 0.6615/0.6609; the width is 45 points. In the event
Open chart in a new window