Прямоугольник
сформирован 16.06 в 19:23:47 (UTC+0)
сила сигнала 1 из 5
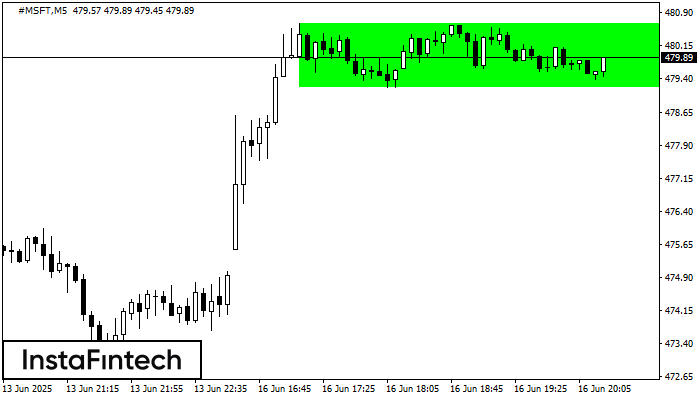
По торговому инструменту #MSFT на M5 сформировалась фигура продолжения тренда - «Прямоугольник». Фигура имеет границы: Нижняя 479.20; Верхняя 480.66. В случае пробоя верхней границы вероятно дальнейшее движение в сторону тренда.
Таймфреймы М5 и М15 могут иметь больше ложных точек входа.
Шунингдек кўринг
- Все
- Все
- Bearish Rectangle
- Bearish Symmetrical Triangle
- Bullish Rectangle
- Double Top
- Double Top
- Triple Bottom
- Triple Bottom
- Triple Top
- Triple Top
- Все
- Все
- Покупка
- Продажа
- Все
- 1
- 2
- 3
- 4
- 5
Bullish Rectangle
was formed on 14.11 at 21:30:40 (UTC+0)
signal strength 2 of 5
According to the chart of M15, NZDCHF formed the Bullish Rectangle which is a pattern of a trend continuation. The pattern is contained within the following borders: the lower border
The M5 and M15 time frames may have more false entry points.
Open chart in a new window
Double Top
was formed on 14.11 at 21:01:29 (UTC+0)
signal strength 4 of 5
On the chart of NZDCAD H1 the Double Top reversal pattern has been formed. Characteristics: the upper boundary 0.7975; the lower boundary 0.7956; the width of the pattern 19 points
Open chart in a new window
Double Top
was formed on 14.11 at 21:00:19 (UTC+0)
signal strength 4 of 5
The Double Top reversal pattern has been formed on NZDUSD H1. Characteristics: the upper boundary 0.5687; the lower boundary 0.5663; the width of the pattern is 24 points. Sell trades
Open chart in a new window


