Медвежий симметричный треугольник
сформирован 18.06 в 12:30:15 (UTC+0)
сила сигнала 2 из 5

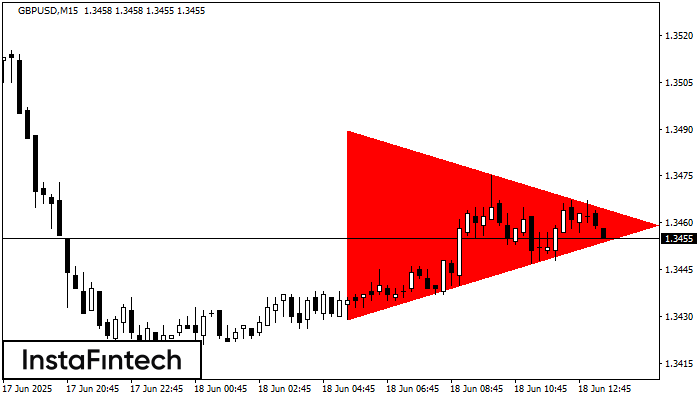
По GBPUSD M15 сформировалась фигура «Медвежий симметричный треугольник». Данная фигура сигнализирует нам о продолжении нисходящего тренда в случае пробоя нижней границы 1.3429, где вероятная прибыль будет являться шириной текущей фигуры -60 пунктов.
Таймфреймы М5 и М15 могут иметь больше ложных точек входа.
Шунингдек кўринг
- Все
- Все
- Bearish Rectangle
- Bearish Symmetrical Triangle
- Bullish Rectangle
- Double Top
- Double Top
- Triple Bottom
- Triple Bottom
- Triple Top
- Triple Top
- Все
- Все
- Покупка
- Продажа
- Все
- 1
- 2
- 3
- 4
- 5
Bearish Rectangle
was formed on 15.07 at 18:21:50 (UTC+0)
signal strength 1 of 5
According to the chart of M5, #PEP formed the Bearish Rectangle which is a pattern of a trend continuation. The pattern is contained within the following borders: lower border 133.77
The M5 and M15 time frames may have more false entry points.
Open chart in a new window
Bearish Rectangle
was formed on 15.07 at 18:21:40 (UTC+0)
signal strength 1 of 5
According to the chart of M5, #PEP formed the Bearish Rectangle which is a pattern of a trend continuation. The pattern is contained within the following borders: lower border 133.77
The M5 and M15 time frames may have more false entry points.
Open chart in a new window
Double Bottom
was formed on 15.07 at 17:30:24 (UTC+0)
signal strength 1 of 5
The Double Bottom pattern has been formed on #TSLA M5; the upper boundary is 320.87; the lower boundary is 312.48. The width of the pattern is 824 points. In case
The M5 and M15 time frames may have more false entry points.
Open chart in a new window