Голова и плечи
сформирован 19.06 в 15:31:33 (UTC+0)
сила сигнала 3 из 5

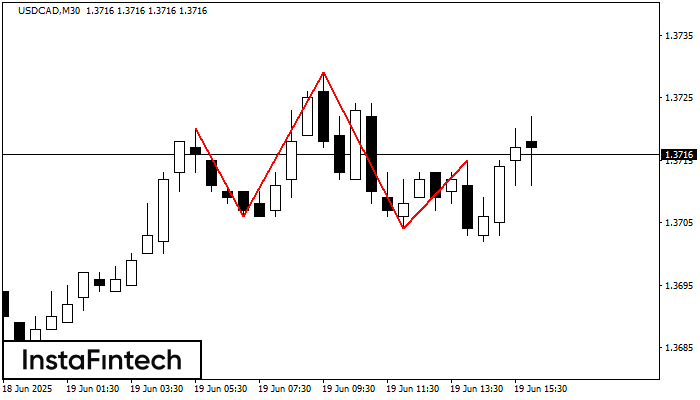
На графике USDCAD M30 сформировалась фигура «Голова и плечи» с характеристикой: Вершина головы 1.3729; Уровень шеи, восходящий угол - 1.3706/1.3704. Формирование данной фигуры может привести к изменению текущей тенденции с восходящей на нисходящую. Вероятно предполагать, что курс USDCAD, в случае срабатывания фигуры, пойдет в направлении 1.3674 (20 - 40 пунктов).
- Все
- Все
- Bearish Rectangle
- Bearish Symmetrical Triangle
- Bullish Rectangle
- Double Top
- Double Top
- Triple Bottom
- Triple Bottom
- Triple Top
- Triple Top
- Все
- Все
- Покупка
- Продажа
- Все
- 1
- 2
- 3
- 4
- 5
Double Bottom
was formed on 19.09 at 04:40:24 (UTC+0)
signal strength 1 of 5
The Double Bottom pattern has been formed on GBPCHF M5; the upper boundary is 1.0739; the lower boundary is 1.0731. The width of the pattern is 8 points. In case
The M5 and M15 time frames may have more false entry points.
Open chart in a new window
Triple Top
was formed on 19.09 at 01:30:38 (UTC+0)
signal strength 1 of 5
The Triple Top pattern has formed on the chart of the AUDJPY M5. Features of the pattern: borders have an ascending angle; the lower line of the pattern
The M5 and M15 time frames may have more false entry points.
Open chart in a new window
Triple Bottom
was formed on 19.09 at 00:31:35 (UTC+0)
signal strength 3 of 5
The Triple Bottom pattern has been formed on AUDUSD M30. It has the following characteristics: resistance level 0.6660/0.6624; support level 0.6615/0.6609; the width is 45 points. In the event
Open chart in a new window