Тройная вершина
сформирован 03.07 в 22:01:02 (UTC+0)
сила сигнала 2 из 5

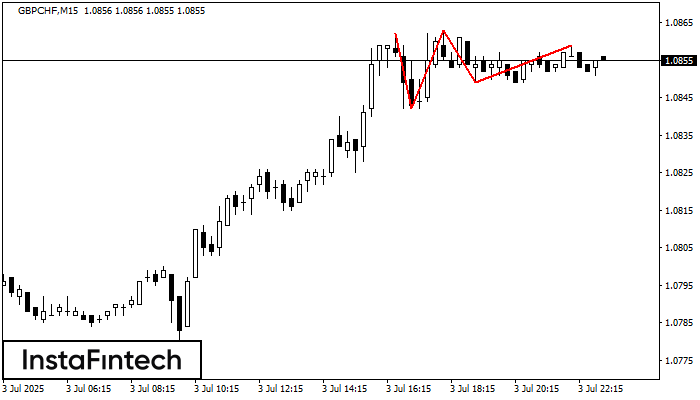
На графике GBPCHF M15 образовалась фигура «Тройная вершина». Данная фигура относится к типу разворотных и имеет характеристику: Верхняя граница 1.0862/1.0859; Нижняя граница 1.0842/1.0849; Ширина фигуры 14 пунктов. Прогноз: В случае пробоя нижней границы 1.0842 вероятно дальнейшее нисходящее движение к уровню 1.0841.
Таймфреймы М5 и М15 могут иметь больше ложных точек входа.
- Все
- Все
- Bearish Rectangle
- Bearish Symmetrical Triangle
- Bullish Rectangle
- Double Top
- Double Top
- Triple Bottom
- Triple Bottom
- Triple Top
- Triple Top
- Все
- Все
- Покупка
- Продажа
- Все
- 1
- 2
- 3
- 4
- 5
Triple Bottom
was formed on 27.08 at 00:00:29 (UTC+0)
signal strength 4 of 5
The Triple Bottom pattern has formed on the chart of the GBPAUD H1 trading instrument. The pattern signals a change in the trend from downwards to upwards in the case
Open chart in a new window
Double Bottom
was formed on 26.08 at 23:30:12 (UTC+0)
signal strength 3 of 5
The Double Bottom pattern has been formed on GBPAUD M30; the upper boundary is 2.0756; the lower boundary is 2.0738. The width of the pattern is 20 points. In case
Open chart in a new window
Triple Bottom
was formed on 26.08 at 22:50:17 (UTC+0)
signal strength 1 of 5
The Triple Bottom pattern has been formed on NZDUSD M5. It has the following characteristics: resistance level 0.5860/0.5857; support level 0.5853/0.5854; the width is 7 points. In the event
The M5 and M15 time frames may have more false entry points.
Open chart in a new window