Двойная вершина
сформирован 06.06 в 11:00:19 (UTC+0)
сила сигнала 4 из 5

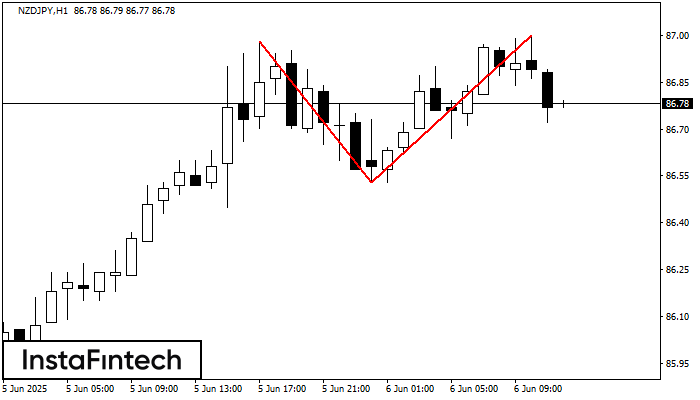
На торговом графике NZDJPY H1 сформировалась разворотная фигура «Двойная вершина». Характеристика: Верхняя граница 87.00; Нижняя граница 86.53; Ширина фигуры 47 пунктов. Сигнал: Пробой нижней границы 86.53 приведет к дальнейшему нисходящему движению с перспективой хода к уровню 86.13.
Shuningdek ko'ring
- Все
- Все
- Bearish Rectangle
- Bearish Symmetrical Triangle
- Bullish Rectangle
- Double Top
- Double Top
- Triple Bottom
- Triple Bottom
- Triple Top
- Triple Top
- Все
- Все
- Покупка
- Продажа
- Все
- 1
- 2
- 3
- 4
- 5
Bullish Rectangle
сформирован 23.07 в 20:33:19 (UTC+0)
сила сигнала 3 из 5
According to the chart of M30, #TSLA formed the Bullish Rectangle which is a pattern of a trend continuation. The pattern is contained within the following borders: the lower border
Открыть график инструмента в новом окне
Bullish Rectangle
сформирован 23.07 в 20:25:19 (UTC+0)
сила сигнала 2 из 5
According to the chart of M15, #TSLA formed the Bullish Rectangle. This type of a pattern indicates a trend continuation. It consists of two levels: resistance 335.91 and support 328.44
The M5 and M15 time frames may have more false entry points.
Открыть график инструмента в новом окне
Bullish Rectangle
сформирован 23.07 в 20:25:09 (UTC+0)
сила сигнала 2 из 5
According to the chart of M15, #TSLA formed the Bullish Rectangle. This type of a pattern indicates a trend continuation. It consists of two levels: resistance 335.91 and support 328.44
The M5 and M15 time frames may have more false entry points.
Открыть график инструмента в новом окне