
 04.11.2020 03:37 PM
USDCAD continues to trade inside a triangle pattern making lower highs and higher lows. Volatility has increased today as news of the US election results flood the media and traders reach instantly. Despite the increased volatility price has been kept inside the triangle boundaries.
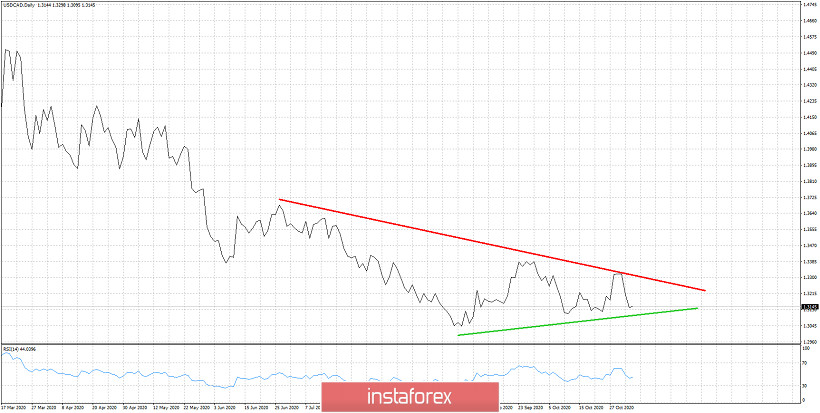
Green line - support
USDCAD is trading between 1.33 and 1.31. With a high at 1.3298 today and a low at 1.3095, price is now trading at 1.3135. There is no clear direction yet as price remains inside the range that is tightening. Soon a break out is expected. We keep a close eye on these two levels. Breaking above 1.33 will lead to a bigger rise to 1.36-1.37. If support at 1.31 fails to hold I expect 1.30 to be challenged and most probably broken.


