
 12.11.2021 04:31 AM
EUR/USD 5M
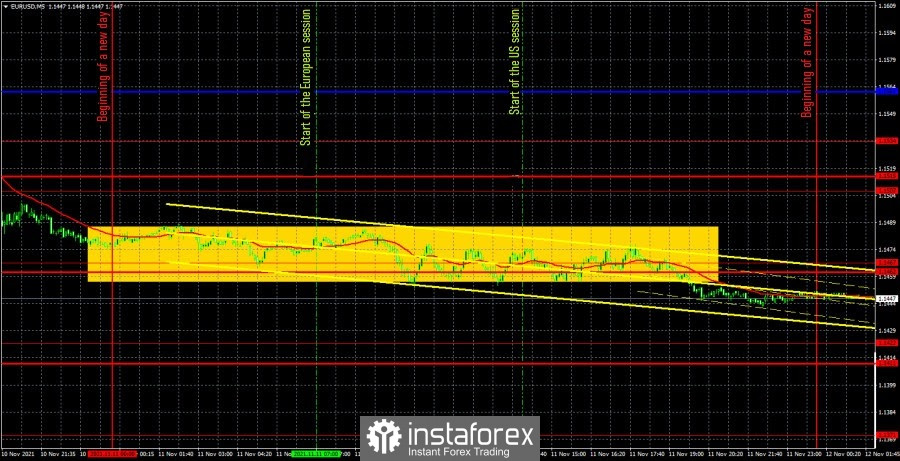
The EUR/USD pair is in its usual mode during the penultimate trading day of the week. Namely, in total flat. After the markets worked out the report on US inflation, which could really plunge into shock, the pair simply stopped moving, but at the same time it is located near its annual lows. In previous articles (especially fundamental ones), we talked about the nature of the pair's movement at the present time. The 800 points that the price has passed from top to bottom since May can be divided into such periods: about ten days when there was a really strong downward movement, and the rest of the days when the pair stood in one place or pretended to decline. Thus, this is exactly the problem: there is a trend, but the nature of the movement itself leaves much to be desired. Yesterday was a vivid illustration of that. How can you work with the pair if it is in a 30-point horizontal channel all day? We didn't even analyze the technical signals, since it became clear from the very night that there would be no movements on Thursday. The bears were still trying to continue moving down at the European trading session, but they gave up very quickly and just started watching the situation. No important macroeconomic report published on November 11. No important fundamental event on November 11. We had a stunningly fun and interesting day, during which not a single transaction was opened. The most interesting thing is that from the current positions, the price can safely continue moving down. That's just it can happen in two days, and in five days.
EUR/USD 1H
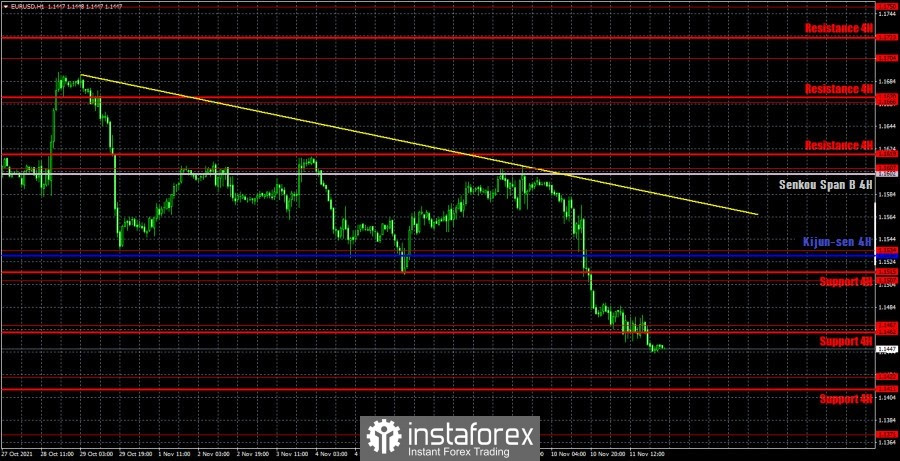
The downward trend quickly formed on the hourly timeframe, quickly reversed, quickly formed anew. As we mentioned above, the problem is that the pair moves trendily somehow too rarely. One trending day, five flat ones. Thus, the trend line just manages to be canceled in a few days of "downtime" that follow the trend. Therefore, the downward trend persists and the pair even falls from time to time, but only such movements usually occur during the days of the strongest statistics or "foundation". We highlight the following levels for trading on Friday – 1.1422, 1.1467, 1.1507, 1.1534, 1.1607, 1.1666, as well as the Senkou Span B (1.1602) and Kijun-sen (1.1530) lines. The lines of the Ichimoku indicator may change their position during the day, which should be taken into account when searching for trading signals. Signals can be rebounds or breakthroughs of these levels and lines. Do not forget about placing a Stop Loss order at breakeven if the price moves 15 points in the right direction. This will protect you against possible losses if the signal turns out to be false. Only a secondary report on industrial production will be released in the European Union, and a secondary report on consumer sentiment from the University of Michigan will be released in the United States on November 12. The probability that the markets will work out this data is very low. Most likely, today we are waiting for another "fun" day, in which you can sit out "on the fence".
We recommend you to familiarize yourself:
Overview of the EUR/USD pair. November 12. US inflation could force the Fed to move faster with monetary tightening.
Overview of the GBP/USD pair. November 12. Great Britain: a trade war with the European Union is just around the corner, a scandal with Boris Johnson.
Forecast and trading signals for GBP/USD for November 12. Detailed analysis of the movement of the pair and trade deals.
Analysis of the COT report
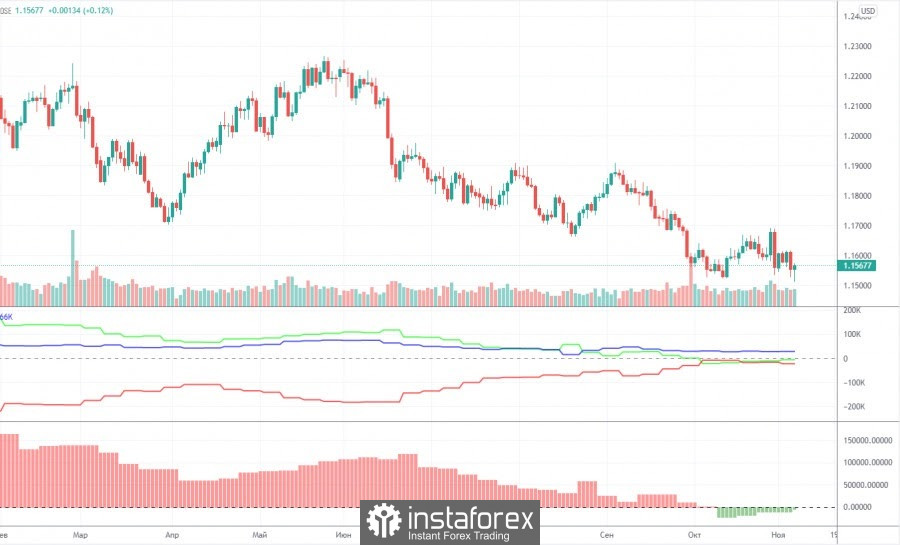
The mood of non-commercial traders changed, but not much, during the last reporting week (October 26-November 1). A group of "non-commercial" traders closed 4,000 buy contracts (longs) and 10.5 thousand sell contracts (shorts) during the reporting week. Consequently, the net position of professional players has grown by 6.5 thousand, which is not so much. However, the changes in the mood of non-commercial traders are best seen by the first indicator in the chart above. The red and green lines have been moving towards each other for a long time, and in the last couple of months they have been almost at the same level. This suggests that the previous trend is ending, and the mood of the major players at this time is as neutral as possible. This is confirmed by the data on the total number of contracts. The non-commercial group has 195,000 buy contracts (longs) and 199,000 sell contracts (shorts). The commercial group has 418,000 buy contracts and 442,000 sell contracts. That is, as we can see, the numbers are almost the same. Therefore, there are theoretical chances for the continuation of the downward movement in the pair. The trend began to end (an upward trend) when the red and green lines (net positions of the commercial and non-commercial groups) began to narrow. That is, for quite a long time. And now, logically, the downward trend continues. However, this "trend" is still not too similar to the trend. Rather, a banal three-wave correction.
Explanations for the chart:
Support and Resistance Levels are the levels that serve as targets when buying or selling the pair. You can place Take Profit near these levels.
Kijun-sen and Senkou Span B lines are lines of the Ichimoku indicator transferred to the hourly timeframe from the 4-hour one.
Support and resistance areas are areas from which the price has repeatedly rebounded off.
Yellow lines are trend lines, trend channels and any other technical patterns.
Indicator 1 on the COT charts is the size of the net position of each category of traders.
Indicator 2 on the COT charts is the size of the net position for the non-commercial group.


