Head and Shoulders
was formed on 10.06 at 07:59:55 (UTC+0)
signal strength 3 of 5

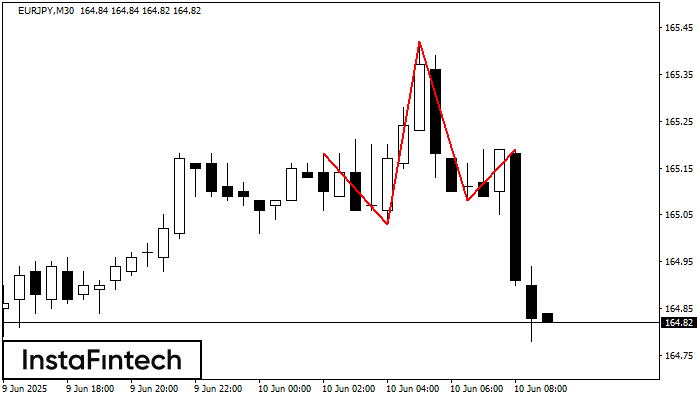
The technical pattern called Head and Shoulders has appeared on the chart of EURJPY M30. There are weighty reasons to suggest that the price will surpass the Neckline 165.03/165.08 after the right shoulder has been formed. So, the trend is set to change with the price heading for 164.78.
See Also
- All
- All
- Bearish Rectangle
- Bearish Symmetrical Triangle
- Bullish Rectangle
- Double Top
- Double Top
- Triple Bottom
- Triple Bottom
- Triple Top
- Triple Top
- All
- All
- Buy
- Sale
- All
- 1
- 2
- 3
- 4
- 5
Bearish Rectangle
was formed on 26.09 at 19:32:27 (UTC+0)
signal strength 2 of 5
According to the chart of M15, #PEP formed the Bearish Rectangle which is a pattern of a trend continuation. The pattern is contained within the following borders: lower border 139.84
The M5 and M15 time frames may have more false entry points.
Open chart in a new window
Bullish Symmetrical Triangle
was formed on 26.09 at 19:30:53 (UTC+0)
signal strength 1 of 5
According to the chart of M5, GBPUSD formed the Bullish Symmetrical Triangle pattern, which signals the trend will continue. Description. The upper border of the pattern touches the coordinates 1.3411/1.3402
The M5 and M15 time frames may have more false entry points.
Open chart in a new window
Double Bottom
was formed on 26.09 at 19:30:16 (UTC+0)
signal strength 4 of 5
The Double Bottom pattern has been formed on #PEP H1. This formation signals a reversal of the trend from downwards to upwards. The signal is that a buy trade should
Open chart in a new window