Head and Shoulders
was formed on 13.06 at 15:30:27 (UTC+0)
signal strength 4 of 5
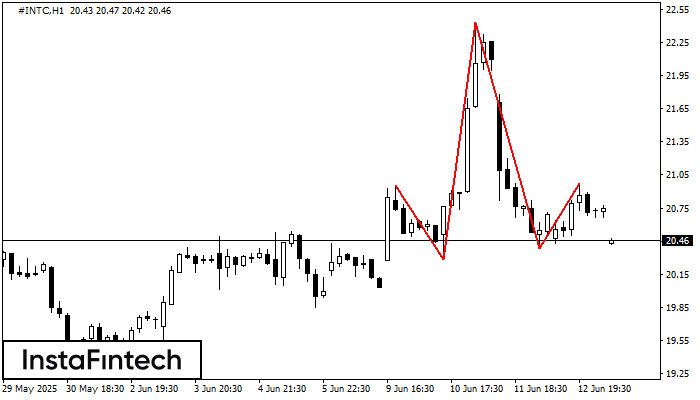
The #INTC H1 formed the Head and Shoulders pattern with the following features: The Head’s top is at 22.43, the Neckline and the upward angle are at 20.28/20.38. The formation of this pattern can bring about changes in the current trend from bullish to bearish. In case the pattern triggers the expected changes, the price of #INTC will go towards 19.98.
See Also
- All
- All
- Bearish Rectangle
- Bearish Symmetrical Triangle
- Bullish Rectangle
- Double Top
- Double Top
- Triple Bottom
- Triple Bottom
- Triple Top
- Triple Top
- All
- All
- Buy
- Sale
- All
- 1
- 2
- 3
- 4
- 5
ट्रिपल बॉटम
was formed on 21.08 at 04:00:56 (UTC+0)
signal strength 3 of 5
ट्रिपल बॉटम पैटर्न NZDUSD M30 ट्रेडिंग इंस्ट्रूमेंट के चार्ट पर बना है। 0.5830/0.5823 के टूटने की स्थिति में पैटर्न नीचे से ऊपर की ओर के ट्रेंड में बदलाव का संकेत
Open chart in a new window
डबल टॉप
was formed on 21.08 at 02:10:08 (UTC+0)
signal strength 1 of 5
GBPAUD M5 के चार्ट पर डबल टॉप रीवर्सल पैटर्न बना है। विशेषताएं: ऊपरी सीमा 2.0922; निचली सीमा 2.0898; पैटर्न की चौड़ाई 24 पॉइंट्स। संकेत: निचली सीमा के टूटने से 2.0883
M5 और M15 समय सीमा में अधिक फाल्स एंट्री पॉइंट्स हो सकते हैं।
Open chart in a new window
ट्रिपल बॉटम
was formed on 21.08 at 02:00:40 (UTC+0)
signal strength 3 of 5
ट्रिपल बॉटम पैटर्न NZDCAD M30 पर बना है। इसकी निम्नलिखित विशेषताएं हैं: प्रतिरोध स्तर 0.8088/0.8085; समर्थन स्तर 0.8066/0.8067; चौड़ाई 22 पॉइंट्स है। 0.8088 के प्रतिरोध स्तर के टूटने की स्थिति
Open chart in a new window