



实际模式

模式是通过价格在图表中形成的图形模型。 根据其中一项技术分析规定,历史(价格变动)重演。 这意味着价格变动在相同的情况下通常是相似的,这使得有可能以高概率预测情况的进一步发展。
InstaTrade的相关模式是一款易于使用的服务,可让您了解市场的最新变化并及时对市场线索做出反应。 在我们的服务中,您始终可以在任何货币对以及任何时间范围内找到最新和最相关的模式。
Double Bottom
was formed on 25.09 at 19:40:32 (UTC+0)
signal strength 1 of 5
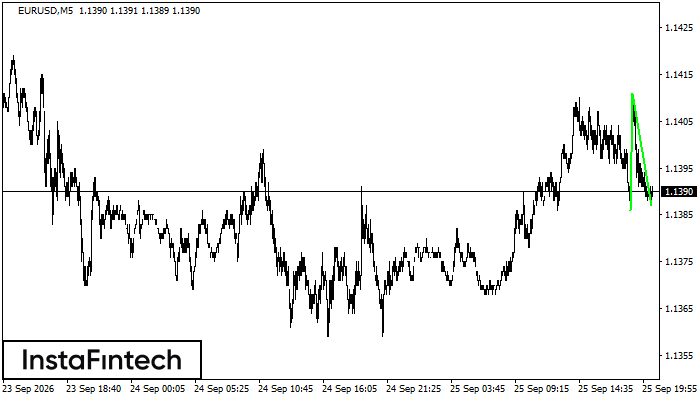
The Double Bottom pattern has formed on the EURUSD M5 chart. Its upper boundary is at 1.1411, its lower boundary is at 1.1387, and its width is 25 points. A break above the upper boundary at 1.1411 may confirm a trend reversal, with the pattern width defining the projected distance to a potential Take Profit level.
The M5 and M15 time frames may generate more false entry signals.
Figure
Instrument
Timeframe
Trend
Signal Strength


