
Lihat juga


 24.07.2026 07:51 AM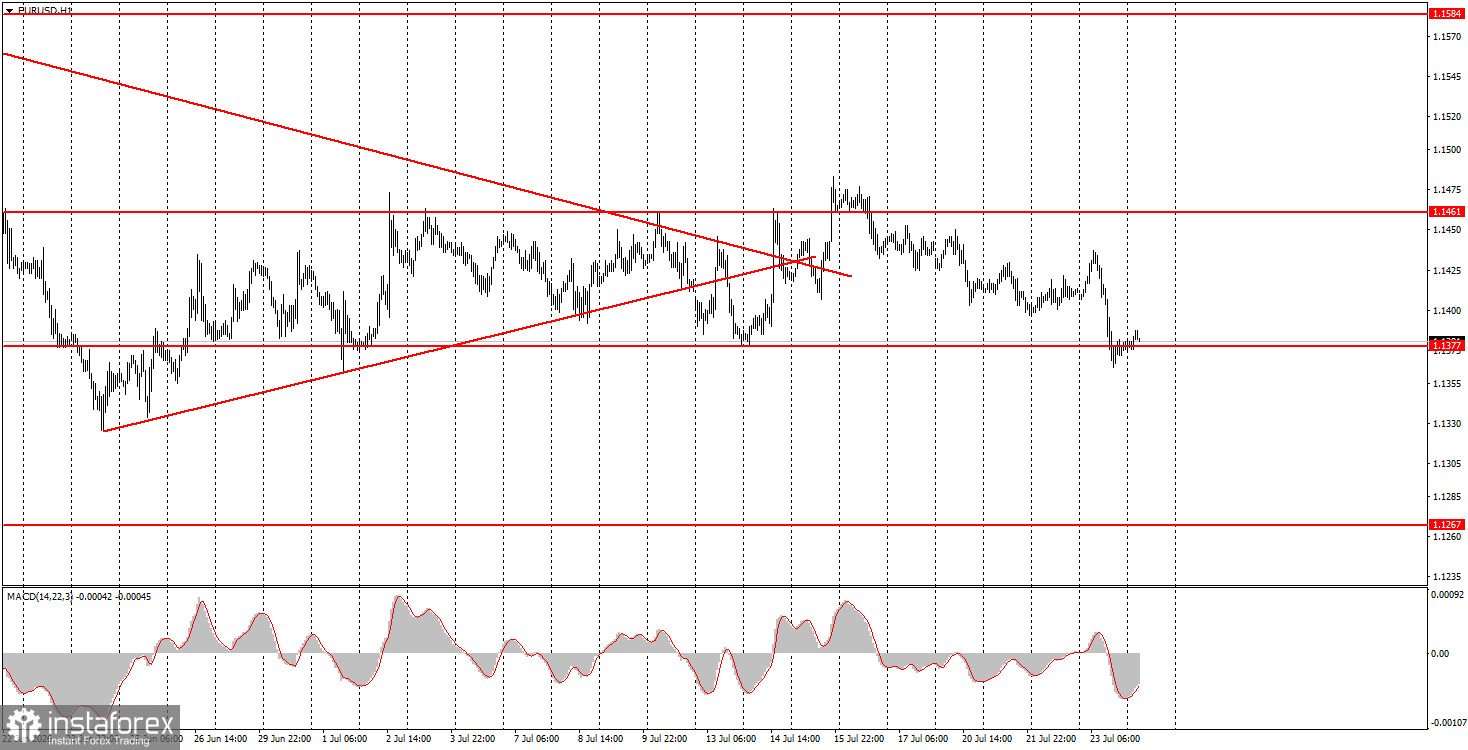
The EUR/USD currency pair continued its decline within the sideways channel that began a week ago. The flat trend has now persisted for four consecutive weeks, which is clearly visible from a distance. At this time, the euro has dropped to the lower boundary of the sideways channel, so either today or on Monday, the flat trend will conclude or the price will bounce off 1.1377 and begin a new upward move toward the upper boundary of the channel. It should be noted that market movements right now are purely technical, and traders continue to ignore much of the macroeconomic and fundamental information. Yesterday, the euro had no grounds for falling. The European Central Bank kept its monetary policy unchanged, but there was nothing dovish about it, as the market was anticipating such a decision. However, Christine Lagarde suggested that rates could be raised as early as September, and inflation could accelerate again, which would require further ECB intervention. This information was ignored, just as the rate hike from a month and a half ago was.
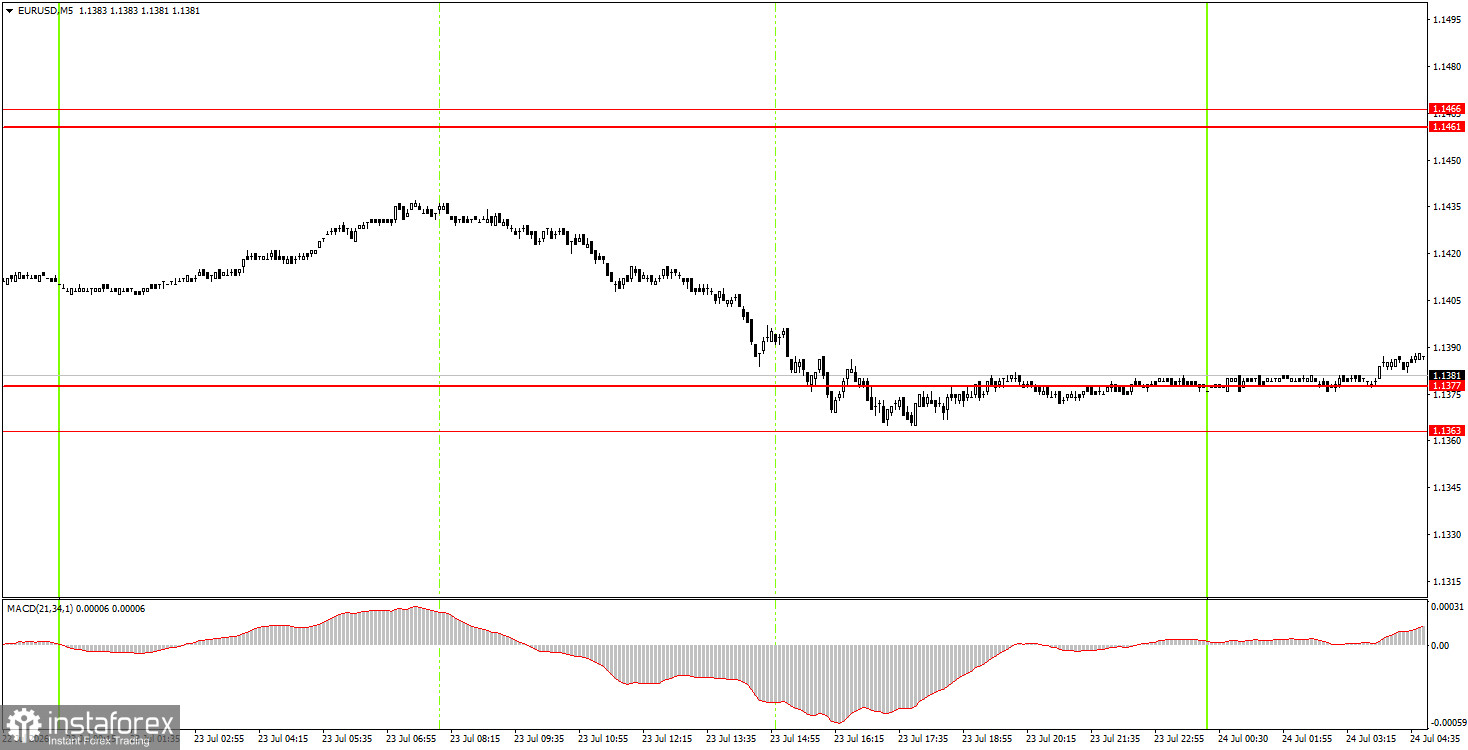
On the 5-minute timeframe, no trading signals were formed on Thursday. The pair declined throughout the day, but only by the end of the day did it manage to work through the area of 1.1363-1.1377. It is around this area that signals are expected to form today.
On the hourly timeframe, both trend lines have been broken and are no longer relevant. Considering all the events and movements in the market over recent months, we believe that the euro should begin a confident rise. However, in reality, all current upward movement is a correction, and in recent weeks, the movement appears much more like a flat than a trend. The market continues to ignore all factors in favor of the euro.
On Friday, novice traders can open short positions targeting 1.1267-1.1275 if the price consolidates below the area of 1.1363-1.1377. Long positions can be opened with a target of 1.1461-1.1466 if the price bounces from the area of 1.1363-1.1377. Volatility may decrease again today.
On the 5-minute timeframe, levels to consider include 1.1267-1.1275, 1.1363-1.1377, 1.1461-1.1466, 1.1527-1.1531, 1.1584-1.1594, 1.1655-1.1666, 1.1745-1.1754. On Friday, business activity indexes for the services and manufacturing sectors for July will be published in Germany, the European Union, and the United States. We would pay attention to the European indexes, while the American ones are likely to be ignored.
Price levels (areas) of support and resistance are targets when opening long or short positions or sources of signals.
Red lines indicate channels or trend lines that display the current trend and indicate the preferred direction for trading.
The MACD indicator (14,22,3) – histogram and signal line – is a supplementary indicator that can also be used as a source of signals.
Important speeches and reports (contained in the news calendar) can significantly impact the movement of the currency pair. Therefore, during their release, trading should be conducted with maximum caution, or one should exit the market to avoid sharp reversals against preceding movements.
Beginners trading in the forex market should remember that not every trade can be profitable. Developing a clear strategy and practicing money management are key to long-term success in trading.


