
Lihat juga


 23.10.2026 12:57 AM
On Thursday, the GBP/USD pair moved into a "bullish" consolidation phase and trades just below the 1.3400 mark, near a new monthly high set during the day.
The fundamental backdrop remains favorable for pound buyers, setting up continued upward movement, as seen over the past week.
The U.S. dollar is struggling to attract buyers and remains near three-week lows set Tuesday, amid falling U.S. government bond yields.
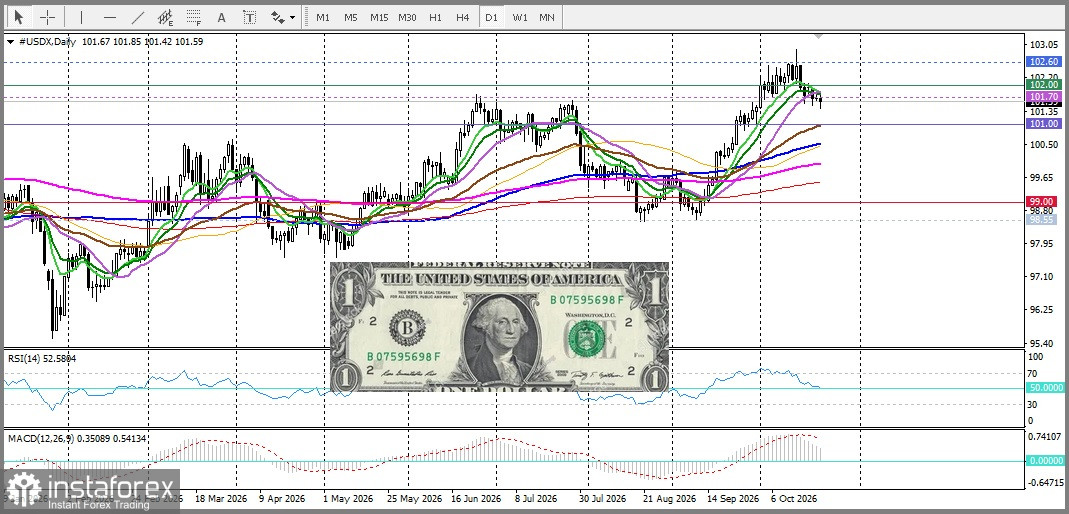
By contrast, the British pound is supported by rising expectations of a Bank of England rate hike in November. An additional factor was an acceleration in UK annual consumer-price inflation in September to an 11-month high. This creates a favorable background for GBP/USD's rise and supports a positive outlook for the pair.
At the same time, a geopolitical risk premium remains due to the threat of further escalation in the Middle East. Iranian foreign minister Abbas Araghchi said Tehran is ready to give diplomacy another chance if it receives convincing evidence of a sincere U.S. desire for a fair settlement. In addition, The New York Times reported that the U.S. and Israel have drawn up plans for a possible new series of strikes on Iran that could be carried out after the U.S. midterm elections.
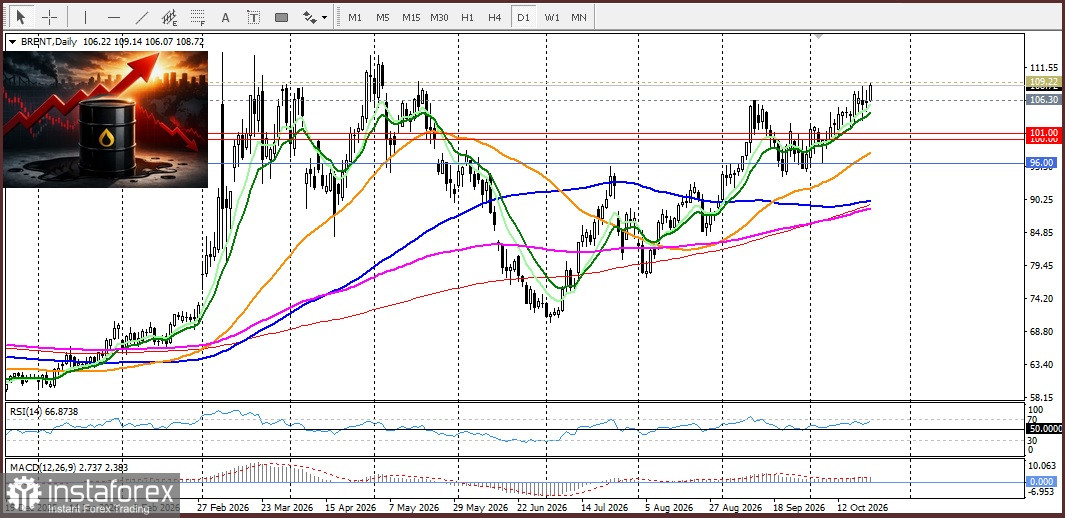
These circumstances support high oil prices, amplify inflationary risks, and raise expectations of imminent further tightening by the Federal Reserve.
According to the CME Group's FedWatch tool, traders assess the probability of a Fed rate hike in December at roughly 90%. This factor limits the dollar's downside potential as a traditional safe haven and prevents market participants from aggressively opening new long positions in GBP/USD.
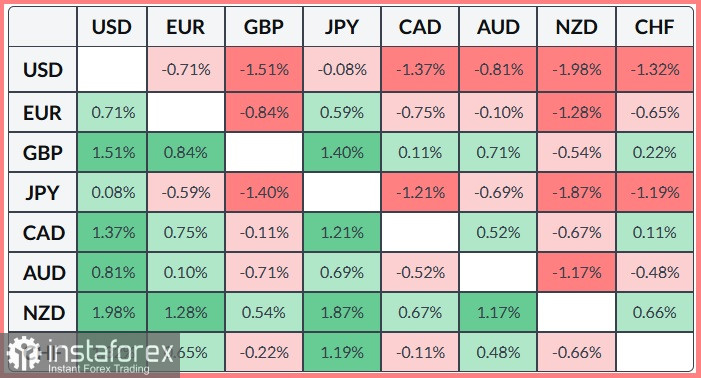
The table below shows the percentage change of the British pound against major world currencies over the past 7 days. The pound showed the best performance versus the US dollar.
From a technical standpoint, GBP/USD trades above the 100-day simple moving average (SMA). This indicates a predominantly neutral short-term bias while also suggesting renewed upside and the formation of a base above this support, the 100-day SMA. The 200-day SMA now represents strong resistance. A break above that level would allow bulls to gain better control of the market. Oscillators are mixed so far, but the relative strength index is positive, indicating a bullish tilt.
You have already liked this post today
*Analisis pasar yang diposting disini dimaksudkan untuk meningkatkan pengetahuan Anda namun tidak untuk memberi instruksi trading.


