Bullish Flag
was formed on 12.06 at 10:30:01 (UTC+0)
signal strength 2 of 5

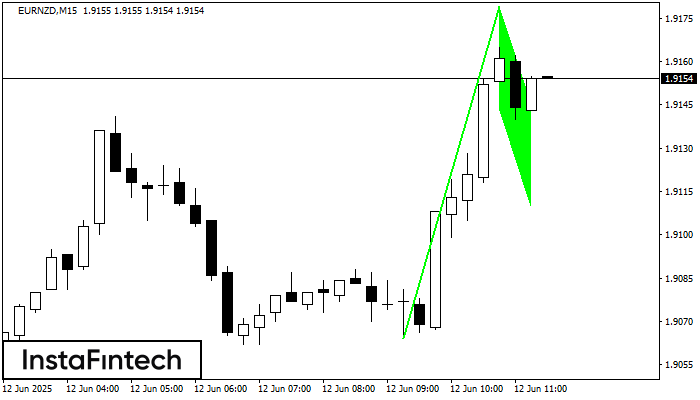
The Bullish Flag pattern which signals continuation of a trend has been formed on the chart EURNZD M15. Forecast: if the price breaks above the pattern high at 1.9179, then traders will be able to place a long deal with the target at 1.9202.
The M5 and M15 time frames may have more false entry points.
- All
- All
- Bearish Rectangle
- Bearish Symmetrical Triangle
- Bullish Rectangle
- Double Top
- Double Top
- Triple Bottom
- Triple Bottom
- Triple Top
- Triple Top
- All
- All
- Buy
- Sale
- All
- 1
- 2
- 3
- 4
- 5
Bullish Symmetrical Triangle
was formed on 02.09 at 22:00:35 (UTC+0)
signal strength 4 of 5
According to the chart of H1, NZDCAD formed the Bullish Symmetrical Triangle pattern, which signals the trend will continue. Description. The upper border of the pattern touches the coordinates 0.8117/0.8078
Open chart in a new window
Bullish Symmetrical Triangle
was formed on 02.09 at 21:45:31 (UTC+0)
signal strength 1 of 5
According to the chart of M5, AUDJPY formed the Bullish Symmetrical Triangle pattern. Description: This is the pattern of a trend continuation. 96.71 and 96.58 are the coordinates
The M5 and M15 time frames may have more false entry points.
Open chart in a new window
Triple Bottom
was formed on 02.09 at 20:15:26 (UTC+0)
signal strength 2 of 5
The Triple Bottom pattern has formed on the chart of the GBPAUD M15 trading instrument. The pattern signals a change in the trend from downwards to upwards in the case
The M5 and M15 time frames may have more false entry points.
Open chart in a new window