Бычий симметричный треугольник
сформирован 06.06 в 06:31:05 (UTC+0)
сила сигнала 3 из 5

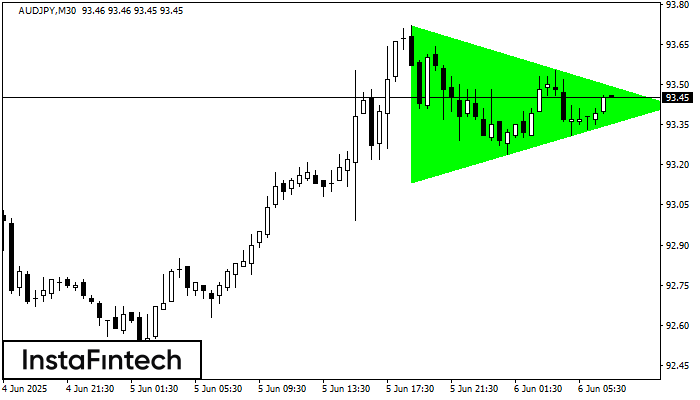
По AUDJPY на M30 фигура «Бычий симметричный треугольник». Характеристика: Фигура продолжения тренда; Координаты границ – верхняя 93.72, нижняя 93.14. Проекция ширины фигуры 58 пунктов. Прогноз: В случае пробоя верхней границы 93.72 цена, вероятнее всего, продолжит движение к 93.72.
Шунингдек кўринг
- Все
- Все
- Bearish Rectangle
- Bearish Symmetrical Triangle
- Bullish Rectangle
- Double Top
- Double Top
- Triple Bottom
- Triple Bottom
- Triple Top
- Triple Top
- Все
- Все
- Покупка
- Продажа
- Все
- 1
- 2
- 3
- 4
- 5
Double Bottom
was formed on 15.08 at 13:00:19 (UTC+0)
signal strength 3 of 5
The Double Bottom pattern has been formed on AUDCHF M30. This formation signals a reversal of the trend from downwards to upwards. The signal is that a buy trade should
Open chart in a new window
Bullish Rectangle
was formed on 15.08 at 12:13:27 (UTC+0)
signal strength 4 of 5
According to the chart of H1, GBPAUD formed the Bullish Rectangle. The pattern indicates a trend continuation. The upper border is 2.0859, the lower border is 2.0802. The signal means
Open chart in a new window
Bullish Rectangle
was formed on 15.08 at 12:13:12 (UTC+0)
signal strength 3 of 5
According to the chart of M30, GBPAUD formed the Bullish Rectangle. This type of a pattern indicates a trend continuation. It consists of two levels: resistance 2.0859 and support 2.0802
Open chart in a new window