Bullish Symmetrical Triangle
was formed on 06.06 at 06:31:05 (UTC+0)
signal strength 3 of 5

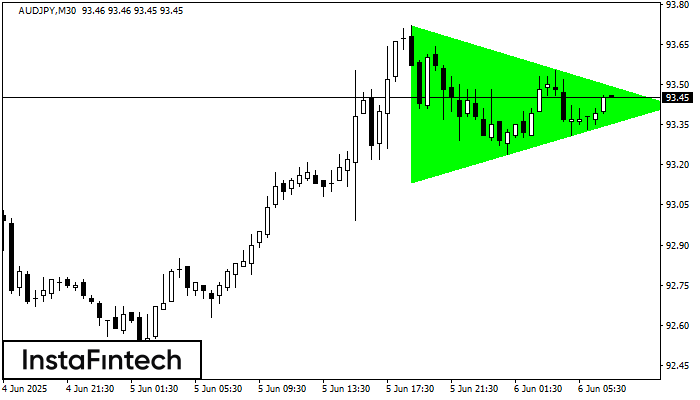
According to the chart of M30, AUDJPY formed the Bullish Symmetrical Triangle pattern. Description: This is the pattern of a trend continuation. 93.72 and 93.14 are the coordinates of the upper and lower borders respectively. The pattern width is measured on the chart at 58 pips. Outlook: If the upper border 93.72 is broken, the price is likely to continue its move by 93.72.
Lihat juga
- All
- All
- Bearish Rectangle
- Bearish Symmetrical Triangle
- Bullish Rectangle
- Double Top
- Double Top
- Triple Bottom
- Triple Bottom
- Triple Top
- Triple Top
- All
- All
- Buy
- Sale
- All
- 1
- 2
- 3
- 4
- 5
Kepala dan bahu
was formed on 21.07 at 21:30:28 (UTC+0)
signal strength 3 of 5
#TSLA M30 membentuk pola Kepala dan bahu dengan beberapa fitur berikut: puncak The Head di 337.71, the Neckline dan sudut atas berada di 324.60/326.66. Formasi pola ini dapat membawa perubahan
Open chart in a new window
Kepala dan bahu
was formed on 21.07 at 20:35:11 (UTC+0)
signal strength 1 of 5
Pola teknikal yang disebut Kepala dan bahu telah muncul pada grafik #NTDOY M5. Terdapat banyak alasan untuk harga melewati Neckline 22.22/22.24 setelah Shoulder kanan terbentuk. Jadi, tren akan berubah dengan
Rangka waktu M5 dan M15 mungkin memiliki lebih dari titik entri yang keliru.
Open chart in a new window
Kepala dan bahu
was formed on 21.07 at 20:35:09 (UTC+0)
signal strength 1 of 5
#NTDOY M5 membentuk pola Kepala dan bahu dengan beberapa fitur berikut: puncak The Head di 22.32, the Neckline dan sudut atas berada di 22.22/22.24. Formasi pola ini dapat membawa perubahan
Rangka waktu M5 dan M15 mungkin memiliki lebih dari titik entri yang keliru.
Open chart in a new window