یہ بھی دیکھیں

 06.12.2018 08:43 AM
NZD/USD
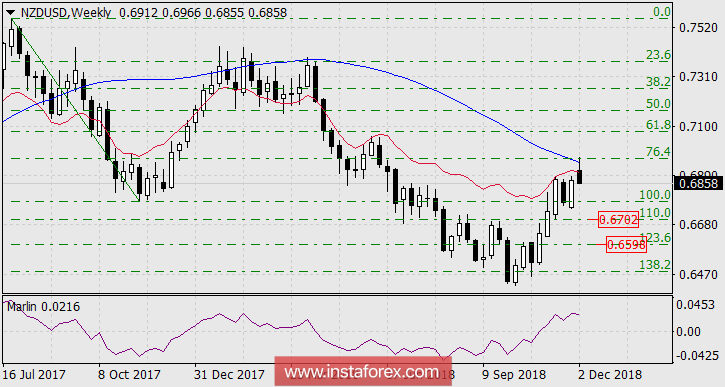
The growth of the New Zealand dollar ended this week's testing areas of convergence of the Krusenstern line with a Fibonacci level of 76.4% on the weekly scale chart. Currently, the price is already below the indicator line of balance. The objectives of the decline also accept Fibonacci levels: 110.0% - 0.6702, 123.6% - 0.6598.
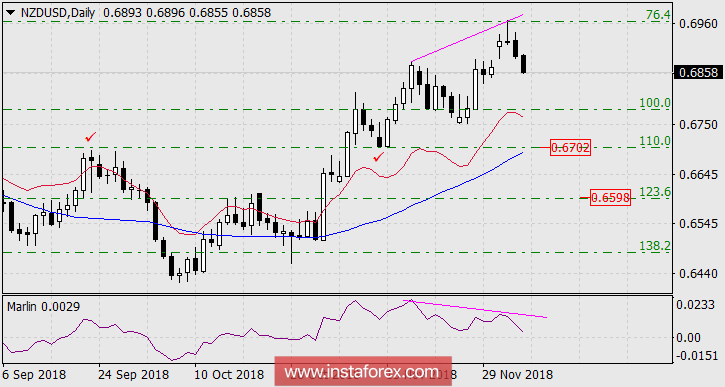
A divergence of the Marlin indicator with the price is formed on the daily scale chart. The support and significance of the first target are also confirmed on this scale by the Krusenstern line (it is approaching the Fibonacci level) and two historical extremums of the September price (peak) and November 12 (low).
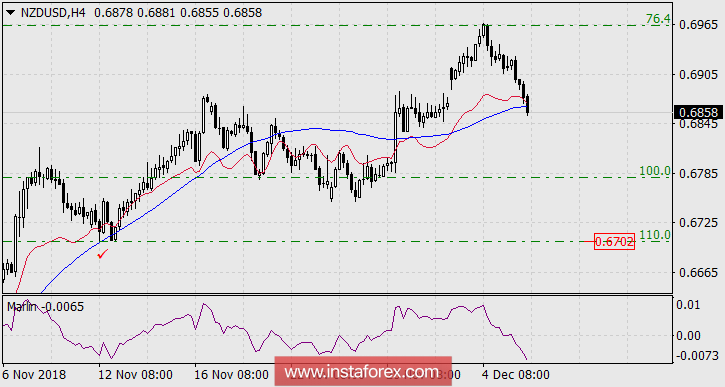
On the H4 chart, the price went under the balance line and the Krusenstern line this morning. Marlin oscillator signals a strong declining moment.
You have already liked this post today
*تعینات کیا مراد ہے مارکیٹ کے تجزیات یہاں ارسال کیے جاتے ہیں جس کا مقصد آپ کی بیداری بڑھانا ہے، لیکن تجارت کرنے کے لئے ہدایات دینا نہیں.


