empty
02.01.2023 12:20 PM
Technical analysis of EUR/USD on January 2023

Trend-following analysis

In January, EUR/USD is expected to move higher from 1.0706, the level of closing the December one-month high, to the target at 1.0941, which is the 50.0% Fibonacci retracement level plotted by the red dotted line. Once this level is tested, the instrument will continue its rise to 1.1104, the historic resistance level plotted by the blue dotted line. After this level is tested, we could expect a downward retracement.

This image is no longer relevant

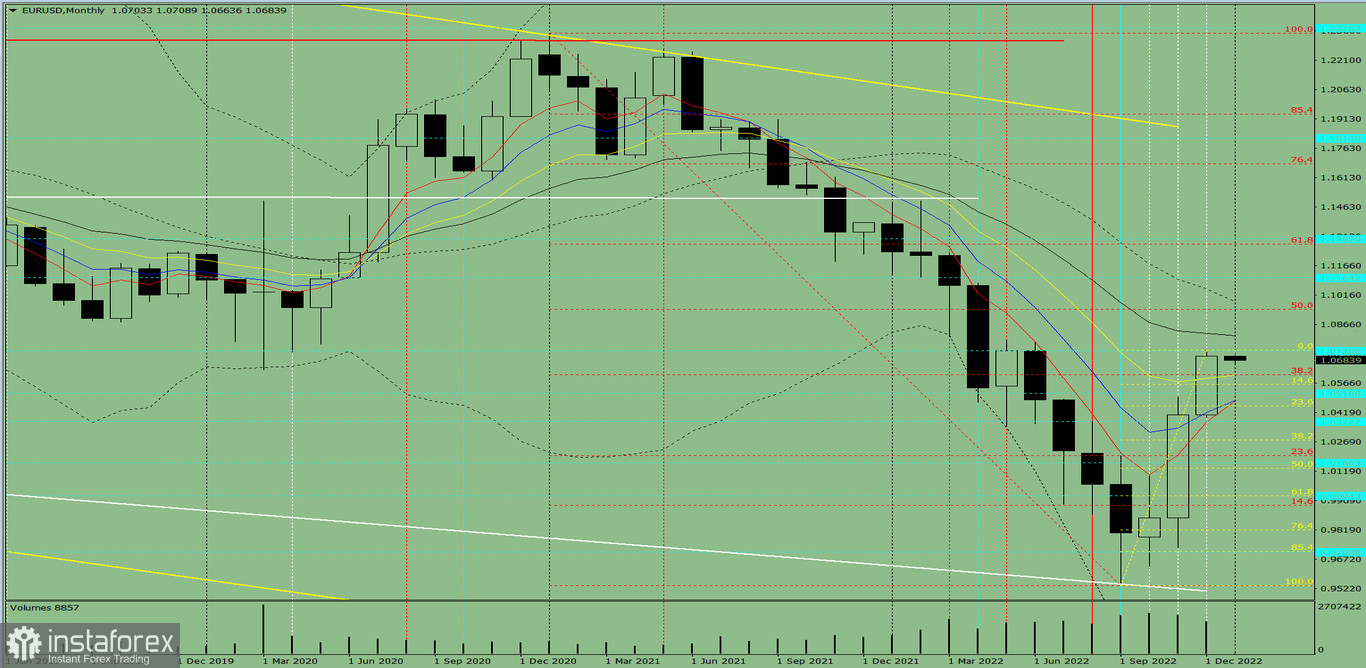
Picture 1, one-month chart

Indicator analysis

  • Indicator analysis – up
  • Fibonacci levels – up
  • A trading volume - up
  • Candlestick analysis – up
  • Trend-following analysis – up
  • Bollinger bands – up

The conclusion from the complex analysis is that EUR/USD is likely to trade higher.

The one-month chart of EUR/USD draws traders to the conclusion that the overall trend is going to be bullish. The one-month white candlestick lacks the first lower shadow in the first week. The second upper shadow is also missing on the final week.

The basic scenario. EUR/USD is expected to move higher from 1.0706, the level of closing the December one-month candlestick, to the target at 1.0941, which is the 50.0% Fibonacci retracement level plotted by the red dotted line. Once this level is tested, the instrument will continue its rise to 1.1104, the historic resistance level plotted by the blue dotted line. After this level is tested, we could expect a downward retracement.

Alternative scenario. EUR/USD might also move higher from 1.0706, the level of closing the December one-month candlestick, towards the target of 1.0941, which is the 50.0% Fibonacci retracement level plotted by the red dotted line. After this level is tested, the price will retrace downwards. 1.0809 serves as a 21-period moving average plotted by the black thin line.

Recommended Stories

جی بی پی / یو ایس ڈی کی پیشن گوئی برائے 13 مارچ 2025

گھنٹہ وار چارٹ پر، جمعہ کو جی بی پی / یو ایس ڈی پئیر 1.3520 کی سطح سے ریباؤنڈ ہوا، 1.3611–1.3620 کے مزاحمتی زون میں بڑھ گیا،

Samir Klishi 12:48 2025-06-13 UTC+2

یورو / یو ایس ڈی کی پیشن گوئی برائے 13 جون 2026

جمعرات کو، یورو / یو ایس ڈی پئیر نے اپنی اوپر کی حرکت کو جاری رکھا اور 1.1574 پر 100.0% فیبوناچی ریٹریسمنٹ کی سطح سے اوپر مستحکم ہو گیا۔ تاہم،

Samir Klishi 12:42 2025-06-13 UTC+2

یورو / یو ایس ڈی 12 جون۔ ڈالر کے لیے ایک دھچکا

اچھا دن، پیارے تاجروں! بدھ کو، یورو / یو ایس ڈی پئیر نے 1.1374–1.1380 کے سپورٹ زون سے ری باؤنڈ کرنے کے بعد اپنی اوپر کی حرکت جاری رکھی۔

Samir Klishi 14:30 2025-06-12 UTC+2

جی بی پی / یو ایس ڈی 12 جون۔ برطانوی معیشت گر گئی۔

اچھا دن، پیارے تاجروں! گھنٹہ وار چارٹ پر، بدھ کے روز، جی بی پی / یو ایس ڈی جوڑی برطانوی پاؤنڈ کے حق میں پلٹ گئی اور 1.3520 پر 161.8%

Samir Klishi 14:23 2025-06-12 UTC+2

یورو / یو ایس ڈی : تجزیہ اور پیشن گوئی

آج، یورو / یو ایس ڈی پئیر خریداروں کو اپنی طرف متوجہ کر رہا ہے، کمزور امریکی ڈالر کے درمیان جمعہ کے نقصانات کا کچھ حصہ واپس لے رہا ہے۔

Irina Yanina 15:54 2025-06-09 UTC+2

جون 6-10 2025 کے لیے سونے (ایکس اے یو / یو ایس ڈی) کے لیے تجارتی سگنل: $3,365 سے اوپر خریدیں (21 ایس ایم اے - 7/8 مرے)

دوسری طرف، سونے میں تکنیکی اصلاح کی توقع ہے۔ 30 مئی کو، اس نے 3,284 کے ارد گرد ایک فرق چھوڑا، اور اگر یہ 3,350 سے نیچے مستحکم ہوتا ہے،

Dimitrios Zappas 18:11 2025-06-06 UTC+2

جون 6-10 2025 کے لیے یورو / یو ایس ڈی کے لیے تجارتی سگنل: 1.1080 سے اوپر خریدیں (200 ای ایم اے - 6/8 مرے)

ایگل انڈیکیٹر ایک منفی سگنل دکھا رہا ہے، اس لیے ہمیں یقین ہے کہ اگر آنے والے گھنٹوں میں یورو 6/8 مرے کی سطح سے نیچے گرتا ہے،

Dimitrios Zappas 18:09 2025-06-06 UTC+2

یورو / جے پی وائے : تجزیہ اور پیشن گوئی

یورو / جے پی وائے جوڑا مستحکم مثبت حرکیات کا مظاہرہ کرتا رہتا ہے۔ جگہ کی قیمتیں تین ہفتے کی بلند ترین سطح کے قریب رہیں۔ یورو

Irina Yanina 17:58 2025-06-06 UTC+2

یو ایس ڈی / سی اے ڈی : تجزیہ اور پیشن گوئی

یہ جوڑا خریداروں کو راغب کرنے کی کوشش کر رہا ہے، لیکن اسپاٹ کی قیمتیں سالانہ کم ترین سطح کے قریب رہتی ہیں اور مزید گراوٹ کا شکار دکھائی دیتی

Irina Yanina 17:54 2025-06-06 UTC+2
ابھی فوری بات نہیں کرسکتے ؟
اپنا سوال پوچھیں بذریعہ چیٹ.
 

Dear visitor,

Your IP address shows that you are currently located in the USA. If you are a resident of the United States, you are prohibited from using the services of InstaFintech Group including online trading, online transfers, deposit/withdrawal of funds, etc.

If you think you are seeing this message by mistake and your location is not the US, kindly proceed to the website. Otherwise, you must leave the website in order to comply with government restrictions.

Why does your IP address show your location as the USA?

  • - you are using a VPN provided by a hosting company based in the United States;
  • - your IP does not have proper WHOIS records;
  • - an error occurred in the WHOIS geolocation database.

Please confirm whether you are a US resident or not by clicking the relevant button below. If you choose the wrong option, being a US resident, you will not be able to open an account with InstaTrade anyway.

We are sorry for any inconvenience caused by this message.