empty
11.12.2023 01:25 PM
GBP/USD: trading plan for the US session on December 11th (analysis of morning deals). The pound attempts to recover

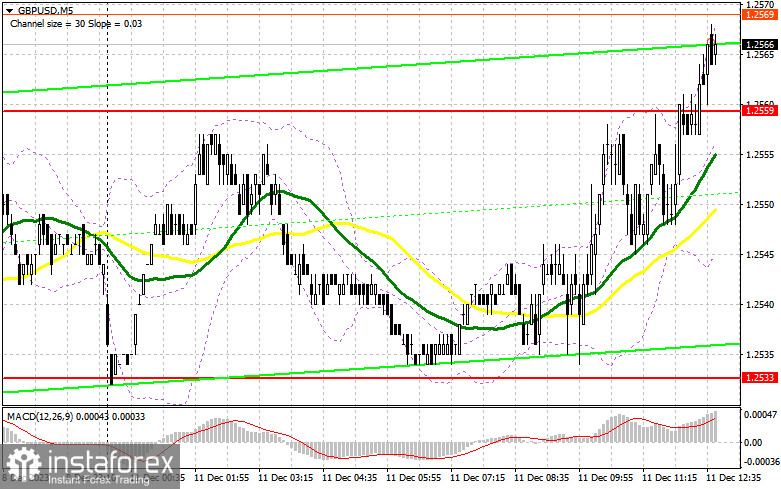
In my morning forecast, I drew attention to the level of 1.2533 and recommended making decisions on market entry based on it. Let's take a look at the 5-minute chart and analyze what happened there. A decline occurred, but we never reached the test of 1.2533, so I didn't wait for entry signals. Considering the low market volatility, the technical picture has not been revised for the second half of the day.

This image is no longer relevant

To open long positions on GBP/USD, the following is required:

Low trading volume and the absence of statistics prevented pound sellers from achieving the development of Friday's scenario. Given that there are no significant statistics for the second half of the day, including in the U.S., one can expect the pound's continued growth. However, before buying near the local maximum, it would be more interesting to wait for a decline and the formation of a false breakout around 1.2533. Only this will provide an entry point into long positions to recover GBP/USD and update the area of 1.2559, formed at the end of last Friday. There, the moving averages, favoring sellers, are also located. Breaking through and consolidating above this range will lead to the removal of stop orders and a more rapid rise of the pound to around 1.2559. The ultimate target will be the area of 1.2583, where I will take profit. In the scenario of a decline in the pair and the absence of bullish activity at 1.2533 in the second half of the day, nothing terrible will happen for buyers. In such a case, only a false breakout around the next support level of 1.2506, acting as the lower boundary of the sideways channel, will signal the opening of long positions. I plan to buy GBP/USD immediately on the rebound only from 1.2478 with the target of a 30-35 point correction within the day.

To open short positions on GBP/USD, the following is required:

Sellers show relatively little activity for now and are unlikely to offer anything around 1.2561 in the second half of the day. Only the formation of a false breakout there, where the moving averages are located, will provide a sell signal and a chance for another downward movement to the intermediate support of 1.2533. Only a breakthrough and a reverse test from the bottom to the top of this range in the absence of significant statistics will deal a more serious blow to the positions of bulls, leading to the removal of stop orders and opening the way to the lower boundary of the channel at 1.2506. A more distant target will be the area of 1.2478, where I will take profit. In the scenario of an increase in GBP/USD and the absence of activity at 1.2559 in the second half of the day, everything is leading to this, I will postpone sales until a false breakout at the level of 1.2583. In the absence of downward movement even there, I will sell GBP/USD immediately on the rebound from 1.2609, but only in anticipation of a pair correction down by 30-35 points within the day.

This image is no longer relevant

In the COT report (Commitment of Traders) for November 28, there was a sharp increase in long positions and a slight reduction in shorts. Demand for the pound persists, as statements by the Bank of England Governor Andrew Bailey that the regulator, if not continuing to raise interest rates, will at least maintain them at current highs for a fairly long period to help attract new buyers to the market. Add to this the dovish rhetoric of Federal Reserve representatives, together with its chairman Jerome Powell, and it becomes clear why the pound may continue to rise soon. Important statistics on the U.S. labor market will be released soon, which will clarify everything. In the latest COT report, it is stated that non-commercial long positions increased by 17,996 to the level of 61,296, while non-commercial short positions fell by 207 to the level of 69,191. As a result, the spread between long and short positions increased by 2,442. The weekly closing price rose and amounted to 1.2701 against 1.2543.

This image is no longer relevant

Indicator Signals:

Moving Averages

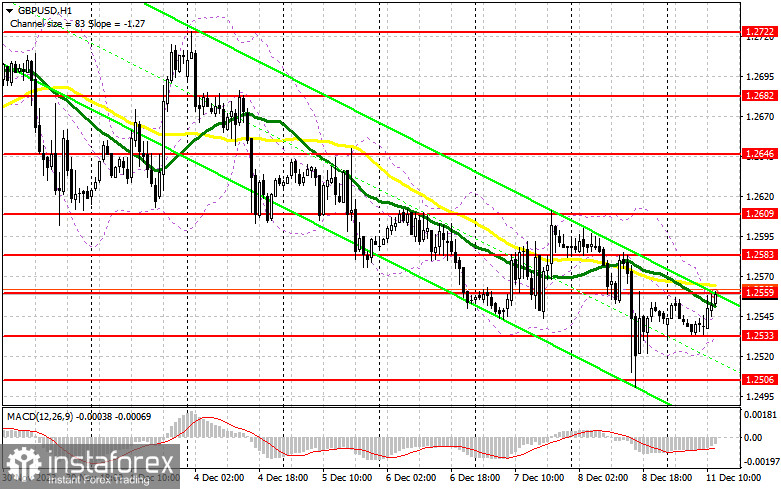
Trading is carried out around the 30 and 50-day moving averages, indicating a sideways market.

Note: The author considers the period and prices of moving averages on the hourly chart H1, which differs from the general definition of classical daily moving averages on the daily chart D1.

Bollinger Bands

In the case of a decline, the lower boundary of the indicator around 1.2535 will act as support.

Description of Indicators

  • Moving average (determines the current trend by smoothing volatility and noise). Period 50. Marked on the chart in yellow.
  • Moving average (determines the current trend by smoothing volatility and noise). Period 30. Marked on the chart in green.
  • MACD indicator (Moving Average Convergence/Divergence). Fast EMA period 12. Slow EMA period 26. SMA period 9
  • Bollinger Bands. Period 20
  • Non-commercial traders - speculators, such as individual traders, hedge funds, and large institutions, use the futures market for speculative purposes and to meet certain requirements.
  • Long non-commercial positions represent the total long open position of non-commercial traders.
  • Short non-commercial positions represent the total short open positions of non-commercial traders.
  • The total non-commercial net position is the difference between the short and long positions of non-commercial traders.

Recommended Stories

26 ستمبر کو برطانوی پاؤنڈ/امریکی ڈالر کے پیئر کی تجارت کیسے کی جائے؟ ابتدائی افراد کے لیے آسان تجاویز اور تجارتی تجزیہ

جمعرات کا تجارتی جائزہ: برطانوی پاؤنڈ/امریکی ڈالر کا 1گھنٹے کا چارٹ جمعرات کو برطانوی پاؤنڈ/امریکی ڈالر جوڑا بھی ڈوب گیا۔ یاد رہے کہ برطانوی پاؤنڈ کے پاس اس کی تازہ

Paolo Greco 14:05 2025-09-26 UTC+2

26 ستمبر کو یورو/امریکی ڈالر کے جوڑے کی تجارت کیسے کی جائے؟ ابتدائی افراد کے لیے آسان تجاویز اور تجارتی تجزیہ

جمعرات کا تجارتی جائزہ: یورو/امریکی ڈالر کا 1گھنٹے کا چارٹ یورو/امریکی ڈالر کرنسی کے جوڑے نے چڑھتے ہوئے رجحان کی لکیر سے نیچے مستحکم ہونے کے بعد جمعرات کو اپنی

Paolo Greco 13:59 2025-09-26 UTC+2

26 ستمبر کو یورو/امریکی ڈالر کے لیے تجارتی سفارشات اور تجارتی تجزیہ۔ امریکی معیشت نے ڈالر کی حمایت کی۔

یورو/امریکی ڈالر کا 5 منٹ کا تجزیہ یورو/امریکی ڈالر کرنسی کے جوڑے نے جمعرات کو اپنی نیچے کی طرف حرکت جاری رکھی، جو اس بار مکمل طور پر جائز تھی۔

Paolo Greco 13:48 2025-09-26 UTC+2

26 ستمبر کو برطانوی پاؤنڈ/امریکی ڈالر کے لیے تجارتی سفارشات اور تجارتی تجزیہ۔ پاؤنڈ کے لیے بد قسمتی کا سلسلہ

برطانوی پاؤنڈ/امریکی ڈالر کا 5 منٹ کا تجزیہ برطانوی پاؤنڈ/امریکی ڈالر کی کرنسی کے جوڑے نے جمعرات کو نیچے کی طرف حرکت جاری رکھی۔ یاد رہے کہ برطانوی کرنسی

Paolo Greco 13:44 2025-09-26 UTC+2

25 ستمبر کو برطانوی پاؤنڈ/امریکی ڈالر کے لیے تجارتی سفارشات اور تجارتی تجزیہ۔ پاؤنڈ سٹرلنگ فلیٹ گوز

برطانوی پاؤنڈ/امریکی ڈالر کا 5 منٹ کا تجزیہ بدھ کو، برطانوی پاؤنڈ/امریکی ڈالر کرنسی کے جوڑے نے اپنی نیچے کی طرف حرکت دوبارہ شروع کی، حالانکہ اس کی کوئی حقیقی

Paolo Greco 14:38 2025-09-25 UTC+2

25 ستمبر کو یورو/امریکی ڈالر کے لیے تجارتی سفارشات اور تجارتی تجزیہ۔ یورپی کرنسی کا زوال

بدھ کو، یورو/امریکی ڈالر کرنسی کے جوڑے نے اچانک اور غیر متوقع طور پر اپنی نیچے کی حرکت کو دوبارہ شروع کر دیا، چڑھتے ہوئے رجحان کی لکیر سے نیچے

Paolo Greco 14:33 2025-09-25 UTC+2

24 ستمبر کے لیے تجارتی سفارشات اور برطانوی پاؤنڈ/امریکی ڈالر کی تجارت کا تجزیہ

برطانوی پاؤنڈ/امریکی ڈالر کا 5 منٹ کا تجزیہ منگل کو برطانوی پاؤنڈ/امریکی ڈالر کرنسی جوڑا بھی ایک آہستگی کے ساتھ تجارت کر رہا تھا، حالانکہ پاؤنڈ کے پاس دوبارہ

Paolo Greco 14:47 2025-09-24 UTC+2

24 ستمبر کے لیے تجارتی سفارشات اور یورو/امریکی ڈالر تجارت کا تجزیہ

یورو/امریکی ڈالر 5 منٹ کا تجزیہ یورو/امریکی ڈالر کرنسی کے جوڑے نے پورے منگل کو ایک آہستگی کے ساتھ تجارت کی۔ میکرو اکنامک ڈیٹا کی ایک بڑی مقدار کے باوجود

Paolo Greco 14:43 2025-09-24 UTC+2

23 ستمبر کو برطانوی پاؤنڈ/امریکی ڈالر کی تجارت کیسے کی جائے؟ نئے افراد کے لیے آسان تجاویز اور تجارتی جائزہ

پیر کا تجارتی جائزہ: برطانوی پاؤنڈ/امریکی ڈالر 1گھنٹے کا چارٹ پیر کے روز،برطانوی پاؤنڈ/امریکی ڈالر جوڑا بھی اونچا چلا گیا، ہفتے کے آخر میں ختم ہونے کے بعد دوبارہ بحال

Paolo Greco 16:27 2025-09-23 UTC+2
ابھی فوری بات نہیں کرسکتے ؟
اپنا سوال پوچھیں بذریعہ چیٹ.
 

Dear visitor,

Your IP address shows that you are currently located in the USA. If you are a resident of the United States, you are prohibited from using the services of InstaFintech Group including online trading, online transfers, deposit/withdrawal of funds, etc.

If you think you are seeing this message by mistake and your location is not the US, kindly proceed to the website. Otherwise, you must leave the website in order to comply with government restrictions.

Why does your IP address show your location as the USA?

  • - you are using a VPN provided by a hosting company based in the United States;
  • - your IP does not have proper WHOIS records;
  • - an error occurred in the WHOIS geolocation database.

Please confirm whether you are a US resident or not by clicking the relevant button below. If you choose the wrong option, being a US resident, you will not be able to open an account with InstaTrade anyway.

We are sorry for any inconvenience caused by this message.