یہ بھی دیکھیں

 24.02.2025 10:30 AM
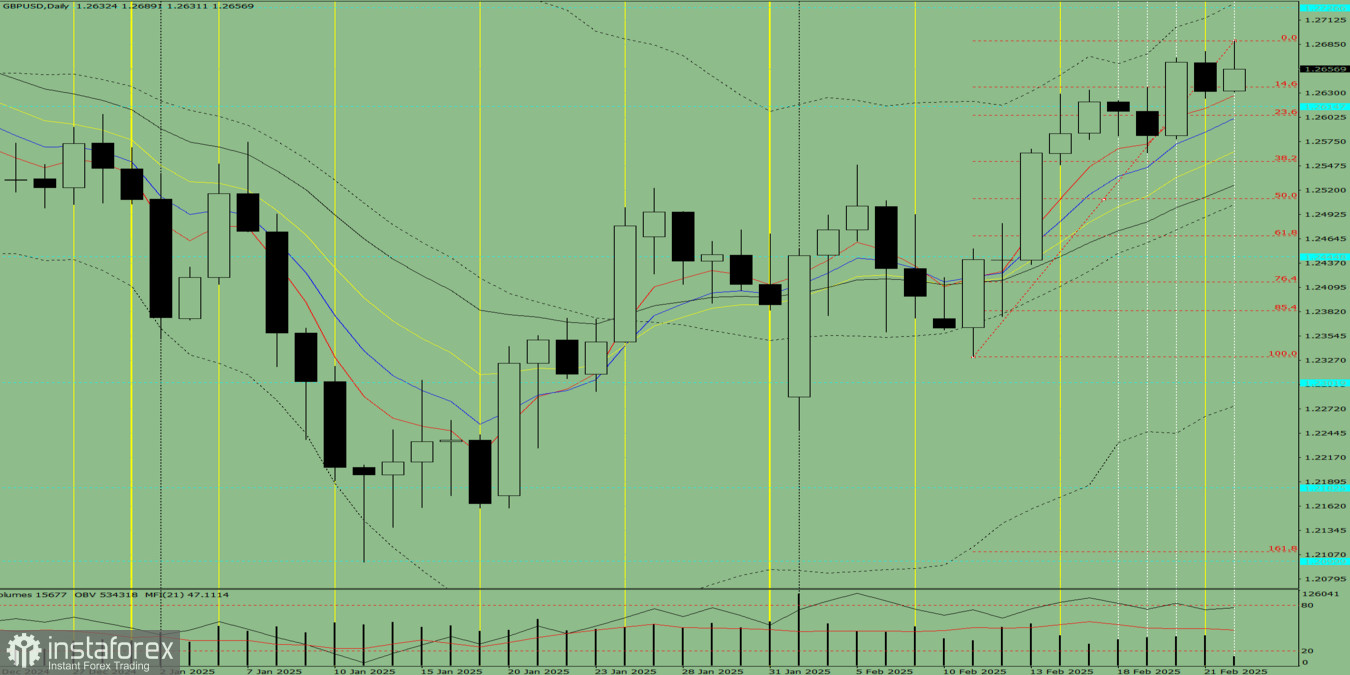
Trend Analysis (Fig. 1)
On Monday, the market may rise from 1.2632 (Friday's closing price) toward 1.2734, the upper boundary of the Bollinger Bands (black dotted line). From this level, the price could begin a pullback downward toward 1.2689, which represents the upper fractal level (red dotted line).
Comprehensive Analysis
The overall market outlook suggests a continued upward movement.
Alternative Scenario
If the price rises from 1.2632 to 1.2689 (upper fractal, red dotted line), it may then reverse downward toward 1.2636, which aligns with the 14.6% Fibonacci retracement level (red dotted line).
You have already liked this post today
*تعینات کیا مراد ہے مارکیٹ کے تجزیات یہاں ارسال کیے جاتے ہیں جس کا مقصد آپ کی بیداری بڑھانا ہے، لیکن تجارت کرنے کے لئے ہدایات دینا نہیں.


