یہ بھی دیکھیں

 24.03.2025 01:55 PM
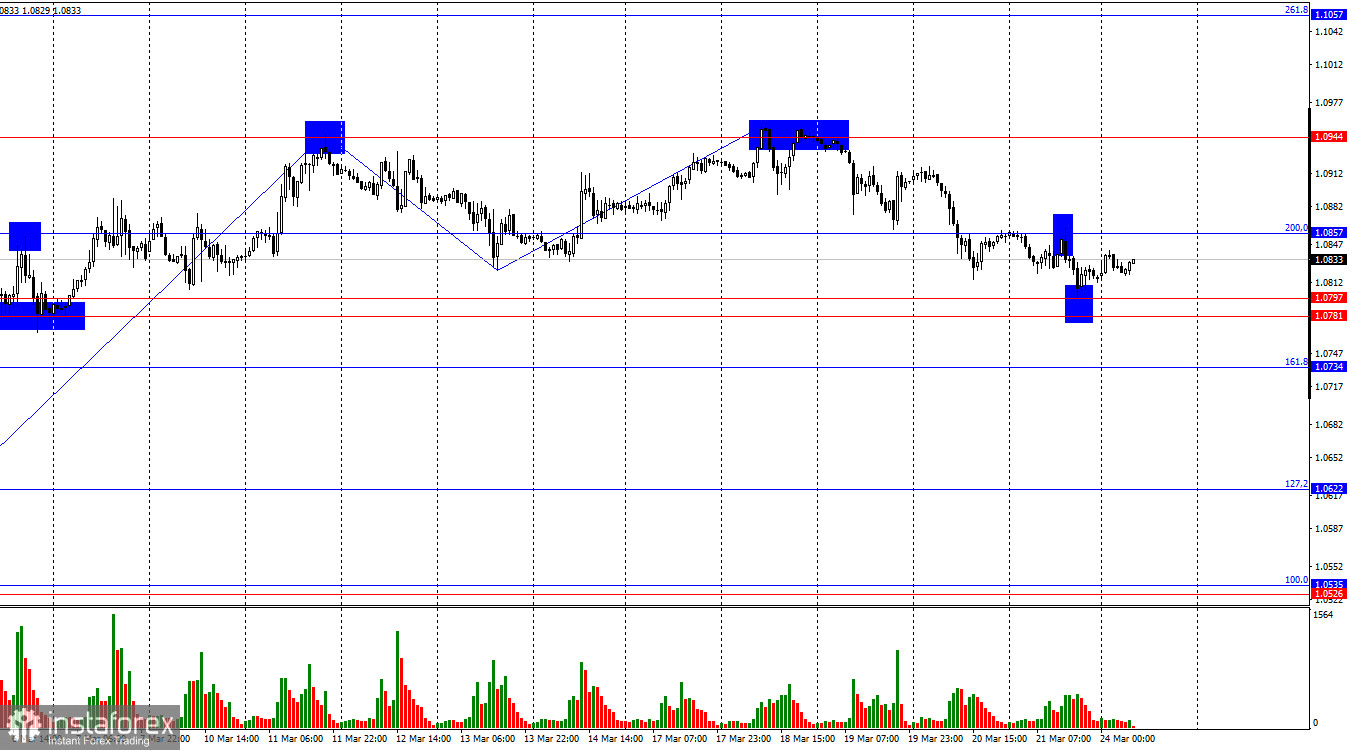
On Friday, the EUR/USD pair rebounded from the 200.0% correction level at 1.0857 and fell to the support zone of 1.0781–1.0797. A rebound from this zone worked in favor of the euro and initiated a move back toward the 1.0857 level. Another rebound from 1.0857 would open the way for a return to 1.0781–1.0797, while a firm consolidation above 1.0857 would bring bulls back into the market and allow for growth toward 1.0944.
The wave pattern on the hourly chart has shifted. The last completed upward wave broke the previous wave's peak by just a few points, and the last downward wave broke the prior low, though not very confidently. Thus, the current wave structure still points to a bullish trend, but it could soon reverse, as bulls seem to be running out of momentum. Donald Trump's tariffs have exerted heavy pressure on the dollar in recent weeks, but that won't last forever.
There was no news background on Friday. The upcoming week is also expected to be relatively uneventful in terms of news and events. There's little interest in the Eurozone, and in the U.S., the GDP report and durable goods orders will draw the most attention. Today, business activity indices will be released across several countries, but they're unlikely to set the tone for the week. The bears remain too weak, and only strong, impactful news could support them. Even the Federal Reserve didn't help the dollar much last week. In my view, the key factor remains Donald Trump's foreign and trade policy. Traders continue to sell the dollar in reaction to every news headline, and I see no reason for them to change this behavior. The U.S. President may soon start a trade war with the European Union and India, so the situation is likely to worsen. The U.S. dollar could enter a new wave of sell-offs, and its popularity no longer matters—nor does its status as the "world reserve currency."
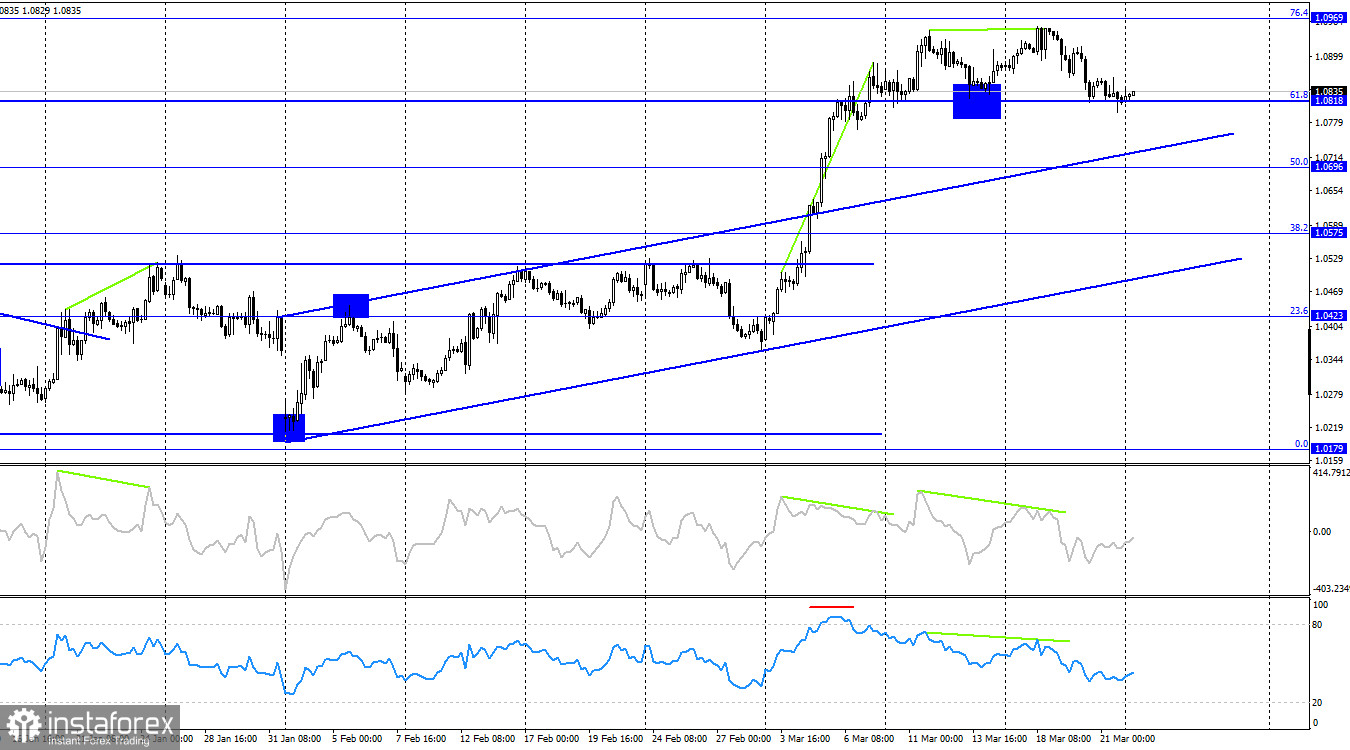
On the 4-hour chart, the pair reversed in favor of the U.S. dollar after forming another bearish divergence and dropped to the 61.8% Fibonacci level at 1.0818. A rebound from this level would work in favor of the euro and initiate growth toward the 76.4% correction level at 1.0969. A close below 1.0818 would suggest further decline toward the 50.0% level at 1.0696.
Commitments of Traders (COT) Report:
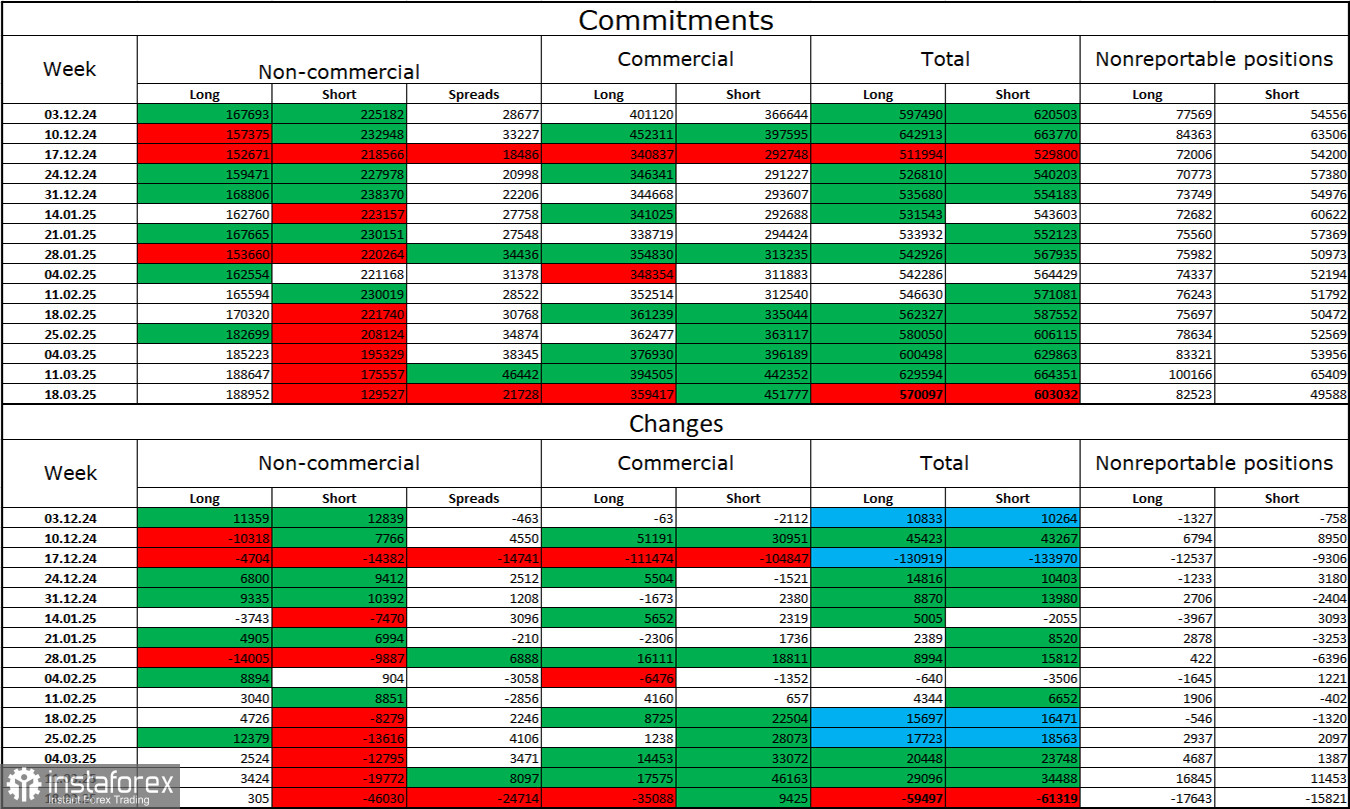
During the last reporting week, professional traders opened 305 Long positions and closed 46,030 Short positions. The sentiment among the "Non-commercial" group has returned to being bullish—thanks to Donald Trump. The total number of Long positions held by speculators now stands at 189,000, while Short positions are down to 129,000.
For 20 consecutive weeks, large players were offloading the euro, but for the past 6 weeks, they've been reducing Shorts and increasing Longs. The difference in monetary policy between the ECB and the Fed continues to support the U.S. dollar, but Trump's policy remains a more influential factor for traders, as it could push the FOMC toward a dovish stance and even trigger a recession in the U.S. economy.
News calendar for the U.S. and Eurozone:
Eurozone – German Manufacturing PMI (08:30 UTC) Eurozone – German Services PMI (08:30 UTC) Eurozone – Eurozone Manufacturing PMI (09:00 UTC) Eurozone – Eurozone Services PMI (09:00 UTC) U.S. – S&P Manufacturing PMI (13:45 UTC) U.S. – S&P Services PMI (13:45 UTC)
The March 24 economic calendar includes six notable entries. Market sentiment is likely to be influenced by the news flow throughout Monday.
EUR/USD Forecast and Trader Advice:
Short positions were possible after a rebound from the 1.0944 level on the hourly chart with targets at 1.0857 and 1.0797. Both targets were reached. New short positions will be possible after a rebound from 1.0857 with targets at 1.0781–1.0797 and 1.0734. Long positions could be considered after a rebound from the 1.0781–1.0797 zone on the hourly chart, or after a close above 1.0857 with a target at 1.0944.
The Fibonacci grids are drawn from 1.0529–1.0213 on the hourly chart and from 1.1214–1.0179 on the 4-hour chart.


