یہ بھی دیکھیں

 26.03.2025 11:32 AM
On Tuesday, the EUR/USD pair once again rebounded from the support zone of 1.0781–1.0797, but the bulls showed weakness due to the lack of a supportive news background. Today, the pair has returned to the same 1.0781–1.0797 zone. Another rebound from this area may result in a slight upward move toward the 200.0% Fibonacci corrective level at 1.0857. A break and consolidation below this zone would suggest further decline toward the next corrective level at 161.8% – 1.0734. For now, trader activity remains low.
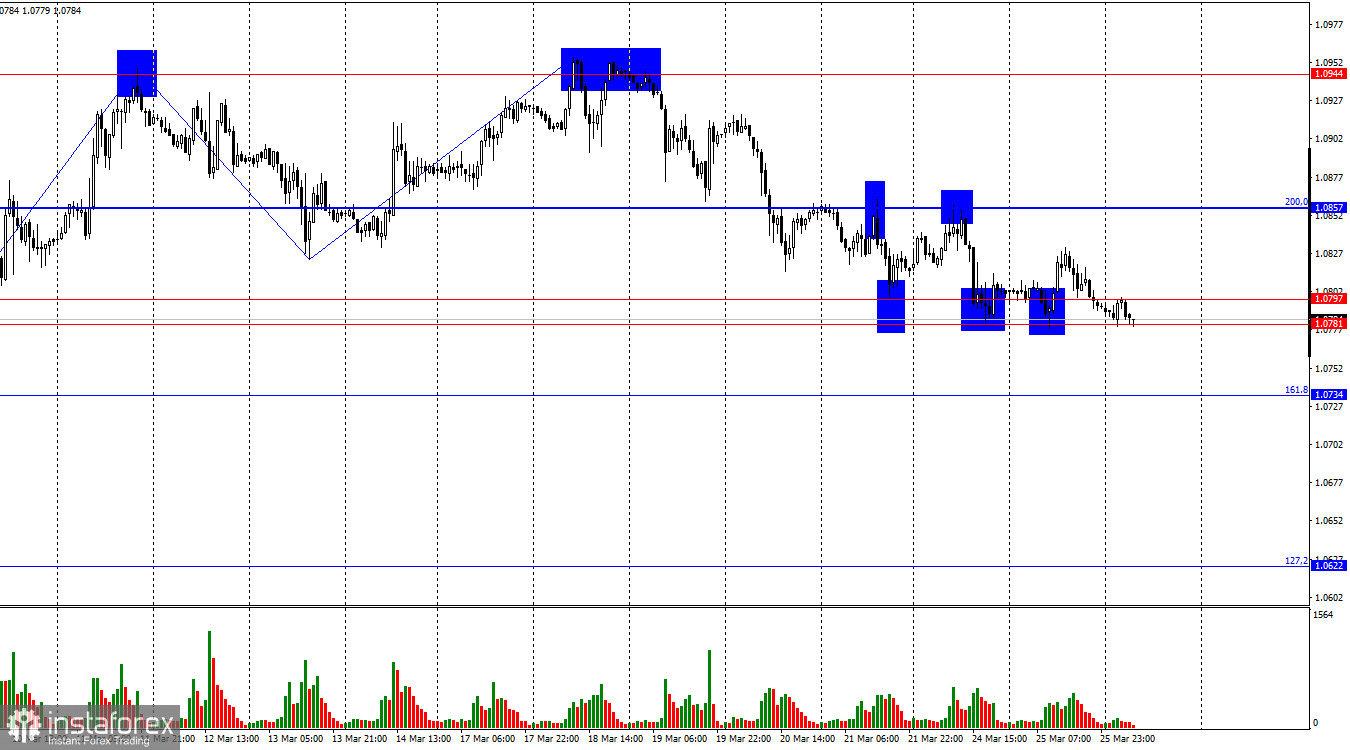
The wave structure on the hourly chart has shifted. The last completed upward wave barely broke above the previous peak, while the latest downward wave broke the prior low. This indicates a gradual shift toward a bearish trend. Trump's tariff rhetoric has placed strong pressure on the dollar in recent weeks, but such market reactions won't last forever—and no new tariffs have yet been introduced.
The fundamental backdrop on Tuesday was extremely weak, making it pointless to analyze reports that had no impact on market sentiment. Today, we will focus on the technical picture. On the hourly chart, we see that the price is being pressed against the 1.0781–1.0797 zone. Since this week's news background is also weak, technical factors will play a decisive role. The pair's gradual decline with repeated tests of this support zone signals that bears are applying pressure, but remain too weak for a sharp breakout. Therefore, I believe that today or tomorrow this support zone may give way. If broken, a strong fall is unlikely, but it may support further strengthening of the U.S. dollar—at least until Donald Trump announces new tariffs, which may happen as soon as next week. So bears have limited time to act.
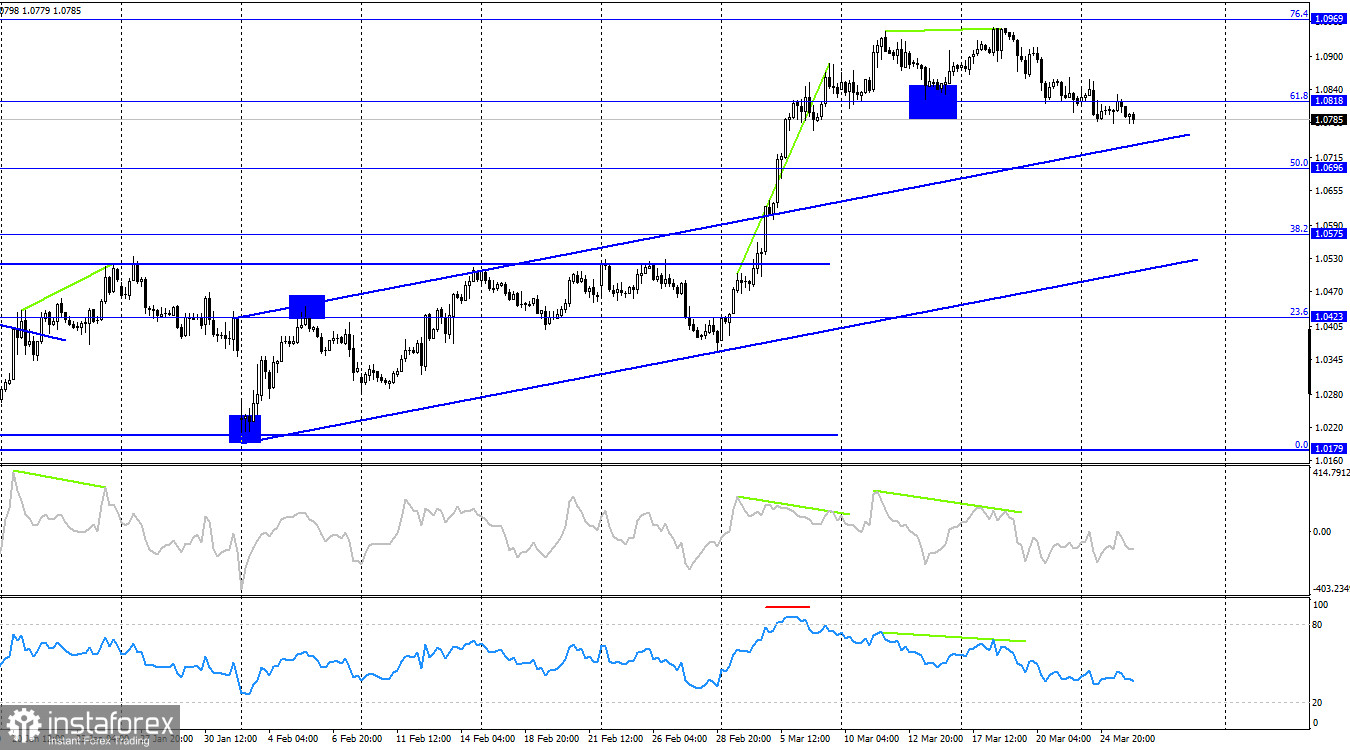
On the 4-hour chart, the pair turned in favor of the U.S. dollar after forming another "bearish" divergence and closing below the 61.8% Fibonacci level at 1.0818. This sets the stage for a continued drop toward the next corrective level at 50.0% – 1.0696. There is room for further decline, as the price is still above the ascending trend channel. No new divergences are forming on any indicators as of now.
Commitments of Traders (COT) Report:
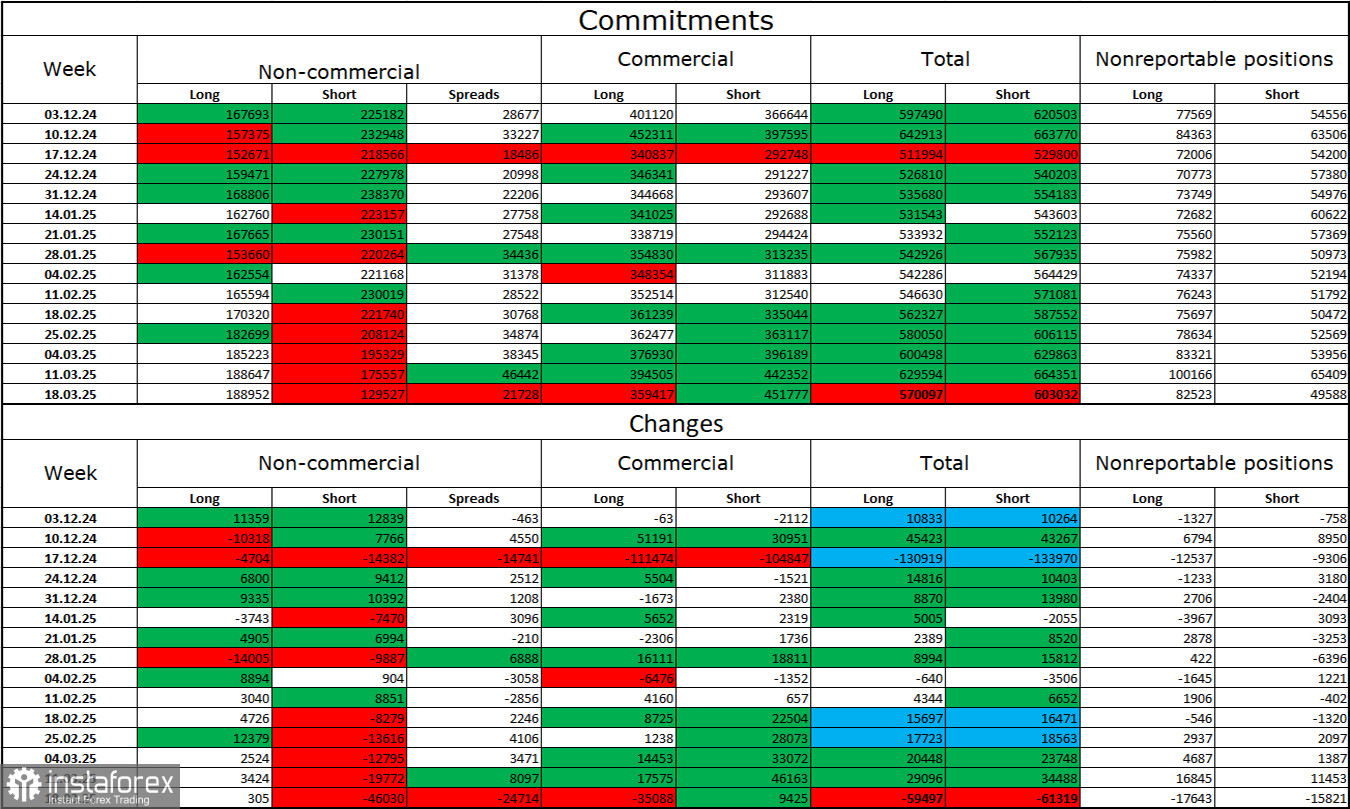
In the latest reporting week, professional traders opened 305 long positions and closed 46,030 short positions. The sentiment of the "Non-commercial" group has once again turned bullish—thanks to Donald Trump. The total number of long positions held by speculators now stands at 189,000, while short positions have fallen to 129,000.
For 20 consecutive weeks, large players were reducing their exposure to the euro, but for the past 6 weeks, they have been cutting shorts and increasing longs. The difference in monetary policy stances between the ECB and the Fed continues to favor the U.S. dollar, but Trump's policies have become a stronger influence, potentially pushing the FOMC toward a more dovish stance and increasing the risk of a U.S. recession.
Economic Calendar for the U.S. and Eurozone:
On March 26, the economic calendar includes just one moderately important event in the U.S. The influence of the news background on market sentiment may increase in the second half of the day.
EUR/USD Forecast and Trading Tips:
Sales of the pair were possible following the rebounds from 1.0944 and 1.0857 on the hourly chart, with targets at 1.0857 and 1.0797. All targets have been reached. New short positions can be considered after a close below the 1.0781–1.0797 zone, with targets at 1.0734 and 1.0622. Long positions can be considered if the pair rebounds from the 1.0781–1.0797 zone on the hourly chart with a target at 1.0857, but for now, the bears are in control.
Fibonacci levels are plotted from 1.0529 to 1.0213 on the hourly chart and from 1.1214 to 1.0179 on the 4-hour chart.


