empty
03.04.2025 01:07 AM
#NDX – March Results and April Outlook

This image is no longer relevant

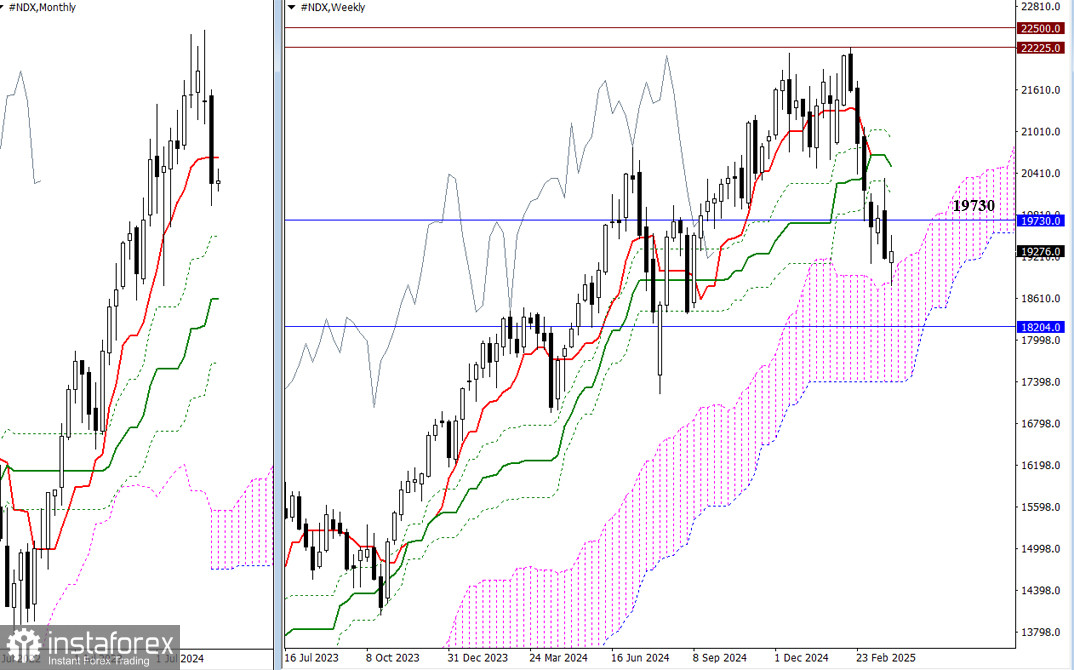
March concluded with a bearish candle that left a notable mark in the history books. Bears closed below the monthly short-term trend level (19,730) and eliminated the weekly golden cross, testing support at the upper boundary of the weekly Ichimoku cloud (18,821). If the decline continues, bearish targets will include testing and breaking through the next monthly support level (18,204) and exiting the weekly cloud (17,408). Should the bulls regain control by reclaiming the monthly short-term trend (19,730), they will aim to retest the levels of the weekly Ichimoku cross (20,103 – 20,508 – 20,914). Consolidation above these resistance levels will open the door for testing and updating the all-time high (22,225).

This image is no longer relevant

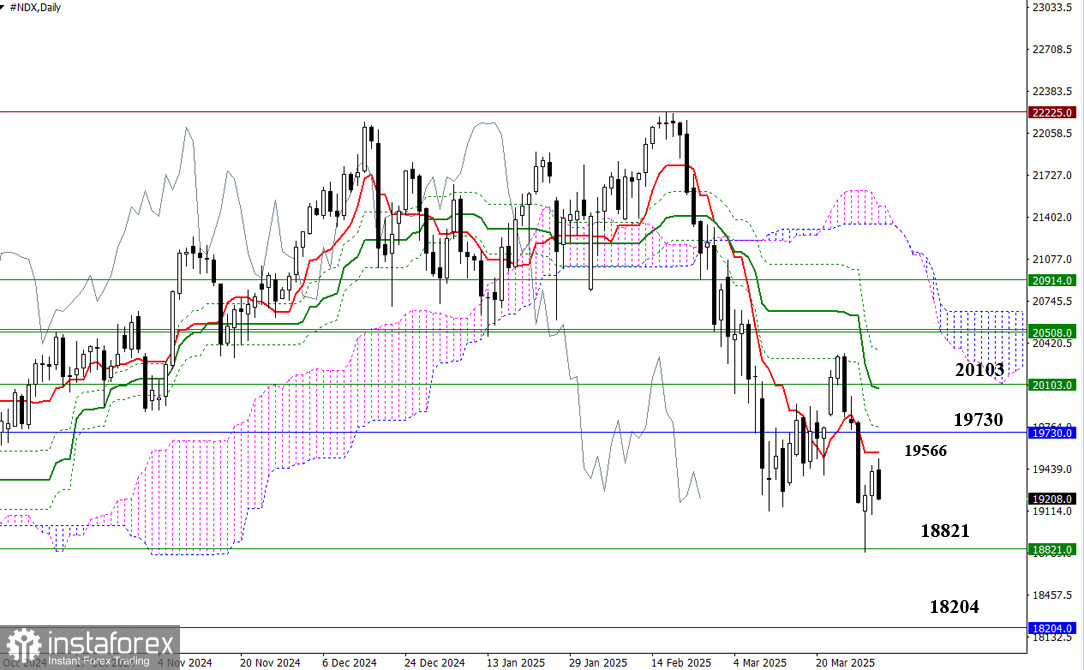
There is currently a downtrend occurring on the daily timeframe, but a corrective move has emerged and aims to test the first key level of the daily correction, which today lies at 19,566 (Tenkan-sen). Additional resistance levels are located at 19,730 – 19,765 – 20,065 – 20,103. A completed corrective climb followed by a drop below the corrective zone (18,792) will confirm a consolidation within the weekly cloud (18,821). The next downward target will be the monthly support at 18,204.

This image is no longer relevant

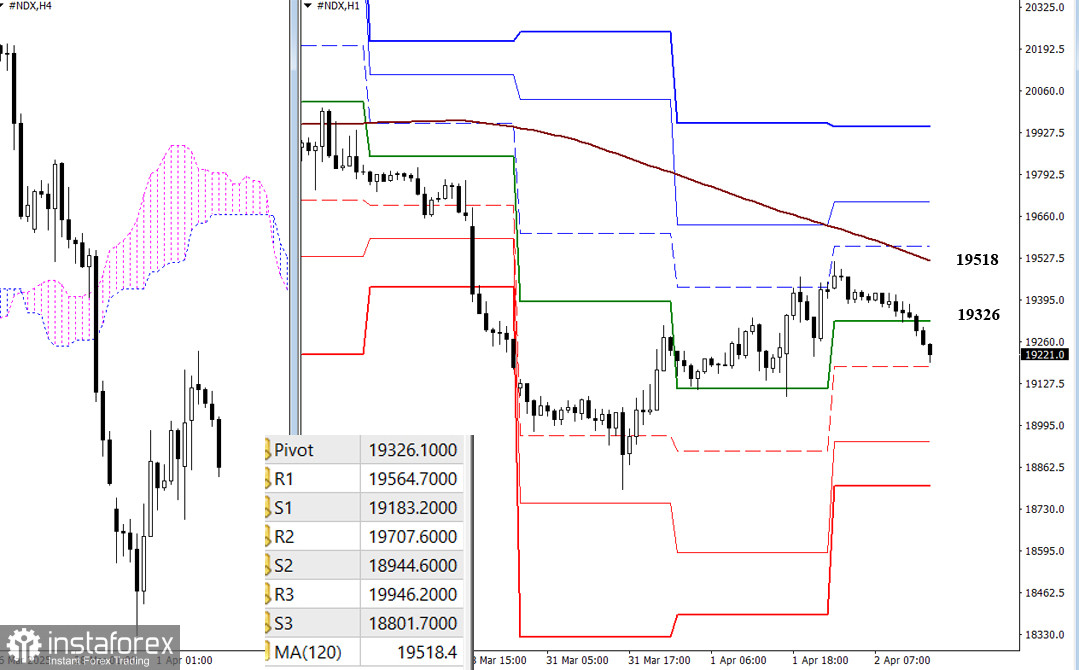
In the lower timeframes, the market is also in the corrective zone, and the main boundary on the way of bulls is the weekly long-term trend (19518). The breakdown and reversal of the trend will allow us to consider new upward benchmarks. The resistance of the classic Pivot levels (19565 - 19708 - 19946) will become these intraday targets. Completing the corrective rise and descent through the support of classic Pivot levels (19183 - 19945 - 18802) will allow an update on the minimum extreme of March (18792) and restore the downtrend.

***

Technical Analysis Components:
  • Higher Timeframes: Ichimoku Kinko Hyo (9.26.52) and Fibonacci Kijun levels
  • H1: Classic Pivot Points and 120-period Moving Average (weekly long-term trend)

Recommended Stories

یورو / یو ایس ڈی کی پیشن گوئی برائے 16 جون 2025

جمعہ کو، یورو / یو ایس ڈی پئیر امریکی ڈالر کے حق میں پلٹ گیا اور 1.1574 پر 100.0% فیبوناچی اصلاحی سطح سے نیچے مستحکم ہو گیا۔ یہ بغیر

Samir Klishi 15:49 2025-06-16 UTC+2

ایکس اے یو / یو ایس ڈی : تجزیہ اور پیشن گوئی

سونا فی الحال اپنے انٹرا ڈے نقصانات کو برقرار رکھے ہوئے ہے۔ اسٹاک مارکیٹوں میں مجموعی طور پر مثبت جذبات بلین کی مانگ کو کم کر رہے ہیں۔ تاہم، عوامل

Irina Yanina 15:10 2025-06-16 UTC+2

جون 13-19 2025 کے لیے سونے کے لیے تجارتی سگنل: 3,343 سے نیچے فروخت (21 ایس ایم اے - 8/8 مرے)

سونا 3,282 اور 3,181 کے قریب ایک گیپ چھوڑ گیا ہے۔ لہذا، اگر قیمت 3,300 کی نفسیاتی سطح سے نیچے آتی ہے، تو ہم توقع کر سکتے

Dimitrios Zappas 19:48 2025-06-13 UTC+2

جون 13-19 2025 کے لیے یورو / یو ایس ڈی کے لیے تجارتی سگنل: 1.1500 سے اوپر خریدیں (21 ایس ایم اے - 7/8 مرے)

مخالف منظر نامے کے تحت، اگر یورو 1.1490 سے نیچے آجاتا ہے، تو اس کے 200 ای ایم اے تک پہنچنے کا امکان ہے، جو 1.1340 پر واقع

Dimitrios Zappas 15:38 2025-06-13 UTC+2

جی بی پی / یو ایس ڈی کی پیشن گوئی برائے 13 مارچ 2025

گھنٹہ وار چارٹ پر، جمعہ کو جی بی پی / یو ایس ڈی پئیر 1.3520 کی سطح سے ریباؤنڈ ہوا، 1.3611–1.3620 کے مزاحمتی زون میں بڑھ گیا،

Samir Klishi 12:48 2025-06-13 UTC+2

یورو / یو ایس ڈی کی پیشن گوئی برائے 13 جون 2026

جمعرات کو، یورو / یو ایس ڈی پئیر نے اپنی اوپر کی حرکت کو جاری رکھا اور 1.1574 پر 100.0% فیبوناچی ریٹریسمنٹ کی سطح سے اوپر مستحکم ہو گیا۔ تاہم،

Samir Klishi 12:42 2025-06-13 UTC+2

یورو / یو ایس ڈی 12 جون۔ ڈالر کے لیے ایک دھچکا

اچھا دن، پیارے تاجروں! بدھ کو، یورو / یو ایس ڈی پئیر نے 1.1374–1.1380 کے سپورٹ زون سے ری باؤنڈ کرنے کے بعد اپنی اوپر کی حرکت جاری رکھی۔

Samir Klishi 14:30 2025-06-12 UTC+2

جی بی پی / یو ایس ڈی 12 جون۔ برطانوی معیشت گر گئی۔

اچھا دن، پیارے تاجروں! گھنٹہ وار چارٹ پر، بدھ کے روز، جی بی پی / یو ایس ڈی جوڑی برطانوی پاؤنڈ کے حق میں پلٹ گئی اور 1.3520 پر 161.8%

Samir Klishi 14:23 2025-06-12 UTC+2

یورو / یو ایس ڈی : تجزیہ اور پیشن گوئی

آج، یورو / یو ایس ڈی پئیر خریداروں کو اپنی طرف متوجہ کر رہا ہے، کمزور امریکی ڈالر کے درمیان جمعہ کے نقصانات کا کچھ حصہ واپس لے رہا ہے۔

Irina Yanina 15:54 2025-06-09 UTC+2

جون 6-10 2025 کے لیے سونے (ایکس اے یو / یو ایس ڈی) کے لیے تجارتی سگنل: $3,365 سے اوپر خریدیں (21 ایس ایم اے - 7/8 مرے)

دوسری طرف، سونے میں تکنیکی اصلاح کی توقع ہے۔ 30 مئی کو، اس نے 3,284 کے ارد گرد ایک فرق چھوڑا، اور اگر یہ 3,350 سے نیچے مستحکم ہوتا ہے،

Dimitrios Zappas 18:11 2025-06-06 UTC+2
ابھی فوری بات نہیں کرسکتے ؟
اپنا سوال پوچھیں بذریعہ چیٹ.
 

Dear visitor,

Your IP address shows that you are currently located in the USA. If you are a resident of the United States, you are prohibited from using the services of InstaFintech Group including online trading, online transfers, deposit/withdrawal of funds, etc.

If you think you are seeing this message by mistake and your location is not the US, kindly proceed to the website. Otherwise, you must leave the website in order to comply with government restrictions.

Why does your IP address show your location as the USA?

  • - you are using a VPN provided by a hosting company based in the United States;
  • - your IP does not have proper WHOIS records;
  • - an error occurred in the WHOIS geolocation database.

Please confirm whether you are a US resident or not by clicking the relevant button below. If you choose the wrong option, being a US resident, you will not be able to open an account with InstaTrade anyway.

We are sorry for any inconvenience caused by this message.