empty
14.04.2025 12:58 AM
#SPX – Summary and Outlook

This image is no longer relevant

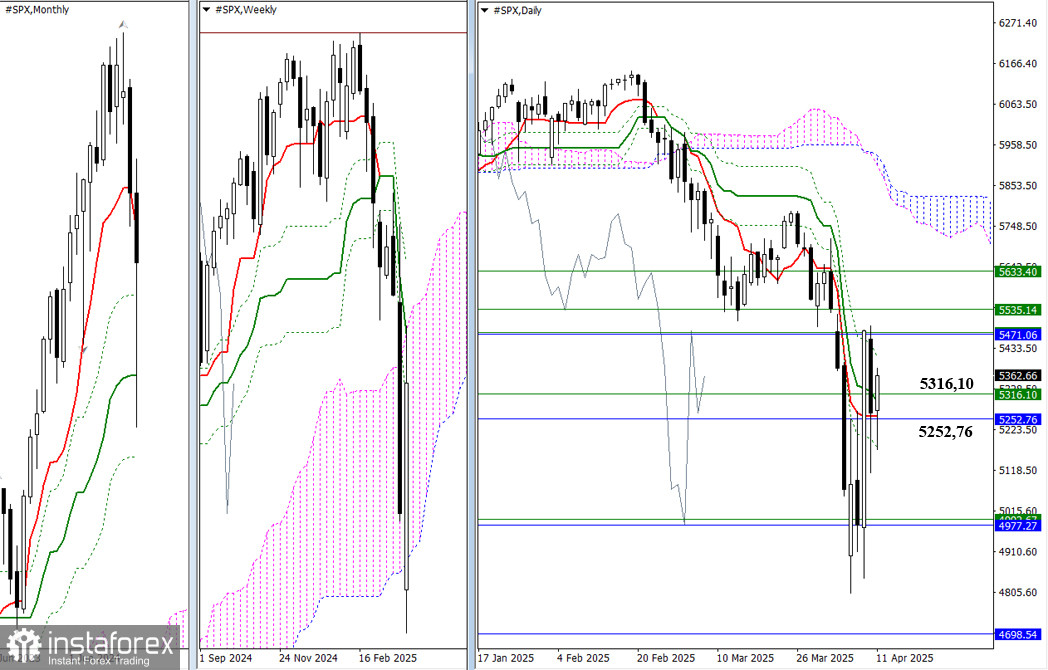
Last week, even though there was a bearish gap, bullish players were able to reclaim their ground effectively. The market is now approaching the point where it may eliminate the daily Ichimoku death cross (5410.90) and re-enter bullish territory in relation to the weekly cloud (5535.14). If that occurs, bulls will gain control of the main weekly trends (5474.69) and the monthly short-term trend (5471.06). Gaining control of these levels would create new opportunities for bulls. The nearest opportunities include eliminating the weekly golden cross at 5633.40 and testing the daily cloud.

Currently, the market is influenced and attracted by the levels of the Ichimoku daily cross (5410.90 – 5294.67 – 5239.35 – 5178.44), as well as the weekly (5316.10) and monthly (5252.76) Fibonacci Kijun levels. Breaking free from the influence of these boundaries would allow for the consideration of new downward targets.

This image is no longer relevant

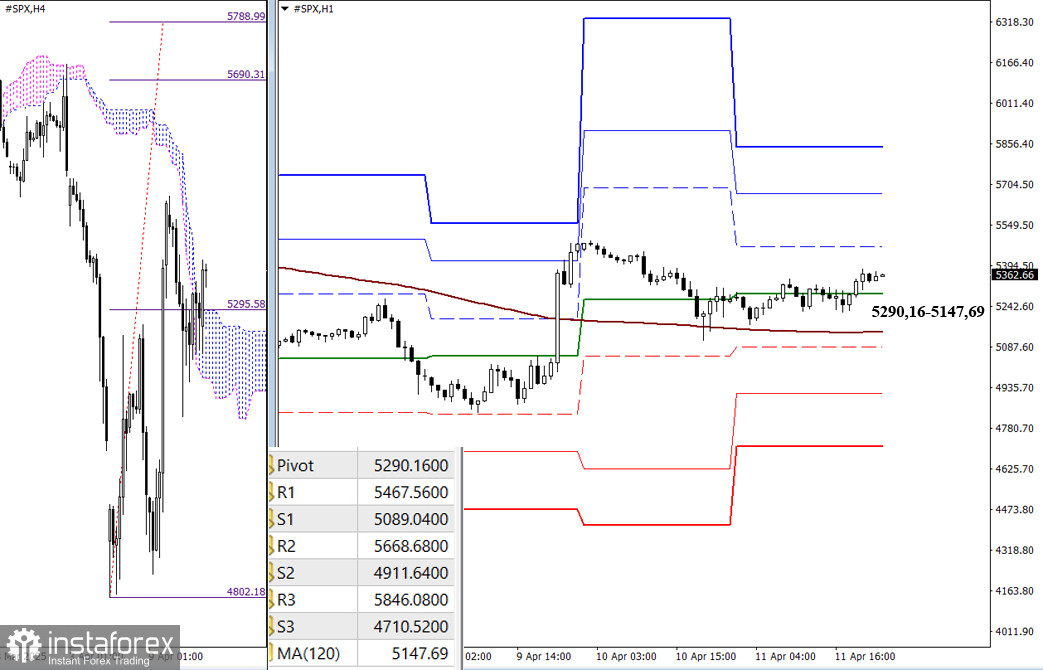
The bulls currently have the primary advantage in the lower timeframes. However, the market has been stuck within a downward corrective zone for an extended period. Breaking out of this corrective zone could enable further upward movement, with intraday resistance targets guided by the classic Pivot levels and the breakout target of the H4 cloud (5690.31 – 5788.99).

If the bears manage to break through the support of the long-term weekly trend (5147.69), they will gain an opportunity to shift the current balance of power. In that case, the key reference points will be the supports of the classic Pivot levels, the updated values of which will become available when the market opens.

***

Technical Analysis Components:
  • Higher Timeframes: Ichimoku Kinko Hyo (9.26.52) and Fibonacci Kijun levels
  • H1: Classic Pivot Points and 120-period Moving Average (weekly long-term trend)

Recommended Stories

جی بی پی / یو ایس ڈی کی پیشن گوئی برائے 13 مارچ 2025

گھنٹہ وار چارٹ پر، جمعہ کو جی بی پی / یو ایس ڈی پئیر 1.3520 کی سطح سے ریباؤنڈ ہوا، 1.3611–1.3620 کے مزاحمتی زون میں بڑھ گیا،

Samir Klishi 12:48 2025-06-13 UTC+2

یورو / یو ایس ڈی کی پیشن گوئی برائے 13 جون 2026

جمعرات کو، یورو / یو ایس ڈی پئیر نے اپنی اوپر کی حرکت کو جاری رکھا اور 1.1574 پر 100.0% فیبوناچی ریٹریسمنٹ کی سطح سے اوپر مستحکم ہو گیا۔ تاہم،

Samir Klishi 12:42 2025-06-13 UTC+2

یورو / یو ایس ڈی 12 جون۔ ڈالر کے لیے ایک دھچکا

اچھا دن، پیارے تاجروں! بدھ کو، یورو / یو ایس ڈی پئیر نے 1.1374–1.1380 کے سپورٹ زون سے ری باؤنڈ کرنے کے بعد اپنی اوپر کی حرکت جاری رکھی۔

Samir Klishi 14:30 2025-06-12 UTC+2

جی بی پی / یو ایس ڈی 12 جون۔ برطانوی معیشت گر گئی۔

اچھا دن، پیارے تاجروں! گھنٹہ وار چارٹ پر، بدھ کے روز، جی بی پی / یو ایس ڈی جوڑی برطانوی پاؤنڈ کے حق میں پلٹ گئی اور 1.3520 پر 161.8%

Samir Klishi 14:23 2025-06-12 UTC+2

یورو / یو ایس ڈی : تجزیہ اور پیشن گوئی

آج، یورو / یو ایس ڈی پئیر خریداروں کو اپنی طرف متوجہ کر رہا ہے، کمزور امریکی ڈالر کے درمیان جمعہ کے نقصانات کا کچھ حصہ واپس لے رہا ہے۔

Irina Yanina 15:54 2025-06-09 UTC+2

جون 6-10 2025 کے لیے سونے (ایکس اے یو / یو ایس ڈی) کے لیے تجارتی سگنل: $3,365 سے اوپر خریدیں (21 ایس ایم اے - 7/8 مرے)

دوسری طرف، سونے میں تکنیکی اصلاح کی توقع ہے۔ 30 مئی کو، اس نے 3,284 کے ارد گرد ایک فرق چھوڑا، اور اگر یہ 3,350 سے نیچے مستحکم ہوتا ہے،

Dimitrios Zappas 18:11 2025-06-06 UTC+2

جون 6-10 2025 کے لیے یورو / یو ایس ڈی کے لیے تجارتی سگنل: 1.1080 سے اوپر خریدیں (200 ای ایم اے - 6/8 مرے)

ایگل انڈیکیٹر ایک منفی سگنل دکھا رہا ہے، اس لیے ہمیں یقین ہے کہ اگر آنے والے گھنٹوں میں یورو 6/8 مرے کی سطح سے نیچے گرتا ہے،

Dimitrios Zappas 18:09 2025-06-06 UTC+2

یورو / جے پی وائے : تجزیہ اور پیشن گوئی

یورو / جے پی وائے جوڑا مستحکم مثبت حرکیات کا مظاہرہ کرتا رہتا ہے۔ جگہ کی قیمتیں تین ہفتے کی بلند ترین سطح کے قریب رہیں۔ یورو

Irina Yanina 17:58 2025-06-06 UTC+2

یو ایس ڈی / سی اے ڈی : تجزیہ اور پیشن گوئی

یہ جوڑا خریداروں کو راغب کرنے کی کوشش کر رہا ہے، لیکن اسپاٹ کی قیمتیں سالانہ کم ترین سطح کے قریب رہتی ہیں اور مزید گراوٹ کا شکار دکھائی دیتی

Irina Yanina 17:54 2025-06-06 UTC+2
ابھی فوری بات نہیں کرسکتے ؟
اپنا سوال پوچھیں بذریعہ چیٹ.
 

Dear visitor,

Your IP address shows that you are currently located in the USA. If you are a resident of the United States, you are prohibited from using the services of InstaFintech Group including online trading, online transfers, deposit/withdrawal of funds, etc.

If you think you are seeing this message by mistake and your location is not the US, kindly proceed to the website. Otherwise, you must leave the website in order to comply with government restrictions.

Why does your IP address show your location as the USA?

  • - you are using a VPN provided by a hosting company based in the United States;
  • - your IP does not have proper WHOIS records;
  • - an error occurred in the WHOIS geolocation database.

Please confirm whether you are a US resident or not by clicking the relevant button below. If you choose the wrong option, being a US resident, you will not be able to open an account with InstaTrade anyway.

We are sorry for any inconvenience caused by this message.