empty
24.04.2025 08:12 PM
USD/JPY: Simple Trading Tips for Beginner Traders on April 24th (U.S. Session)

Trade Analysis and Strategy Tips for the Japanese Yen

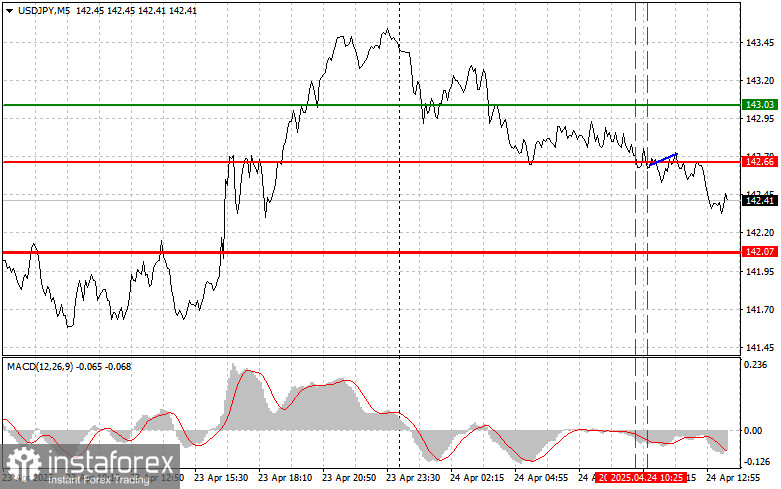
The first test of the 142.66 level occurred when the MACD indicator had already dropped significantly below the zero line, which limited the pair's downward potential. For that reason, I chose not to sell the dollar. The second test of 142.66 happened when the MACD was in oversold territory, which enabled Scenario #2 for buying to unfold. However, as you can see on the chart, the pair failed to show any significant upward momentum.

Today in the second half of the day, investors and traders will focus on key U.S. macroeconomic indicators related to the labor and housing markets. We are expecting weekly initial jobless claims and existing home sales data. A rise in jobless claims could signal a slowdown in hiring and a deteriorating economic outlook, while a decline would indicate labor market resilience.

The existing home sales report is an important indicator of the real estate market and consumer confidence. An increase in sales volume usually reflects growing housing demand and improving economic prospects, while a decrease may suggest market weakness and potential economic risks.

Together, these reports can provide valuable insights into the current state and outlook of the U.S. economy. Strong data would increase demand for the dollar, leading to a rise in the USD/JPY pair.

For intraday strategy, I'll continue to focus on implementing Scenarios #1 and #2.

This image is no longer relevant

Buy Signal

Scenario #1: I plan to buy USD/JPY today after reaching the entry point around 142.60 (green line on the chart), with a target of 143.12 (thicker green line). At 143.12, I plan to exit long positions and open short ones in the opposite direction, expecting a 30–35 point pullback. Buying the pair today only makes sense after very strong U.S. data. Important! Before entering a buy trade, ensure the MACD indicator is above the zero mark and just beginning to rise.

Scenario #2: I also plan to buy USD/JPY if there are two consecutive tests of the 142.29 level when the MACD indicator is in the oversold zone. This would limit the pair's downward potential and lead to a reversal. We can expect growth toward the 142.60 and 143.12 levels.

Sell Signal

Scenario #1: I plan to sell USD/JPY after breaking below 142.29 (red line on the chart), which would likely result in a sharp drop. The main target will be 141.73, where I plan to exit short trades and immediately open longs in the opposite direction, expecting a 20–25 point rebound. Downward pressure may return at any moment today. Important! Before selling, make sure the MACD is below zero and just starting to decline.

Scenario #2: I also plan to sell USD/JPY if there are two consecutive tests of 142.60 while the MACD is in overbought territory. This will cap the pair's upward potential and trigger a downward reversal. A drop toward 142.29 and 141.73 can be expected.
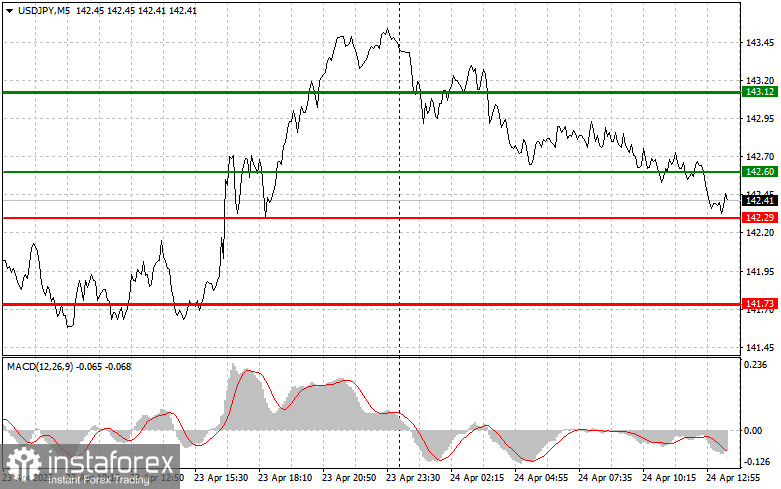
This image is no longer relevant

Chart Key:

  • Thin green line – entry point for long positions
  • Thick green line – suggested Take Profit level or area to lock in profits, as further growth is unlikely above this level
  • Thin red line – entry point for short positions
  • Thick red line – suggested Take Profit level or area to lock in profits, as further decline is unlikely below this level
  • MACD Indicator – use overbought and oversold areas as reference when entering trades

Important: Beginner Forex traders should be very cautious when entering the market. It's best to stay out before major economic reports are released to avoid sudden price swings. If you decide to trade during news events, always set stop-loss orders to minimize losses. Without stop-losses, your entire deposit can be lost very quickly—especially if you don't follow money management and trade with large volumes.

And remember: successful trading requires a clear trading plan like the one provided above. Making spontaneous trading decisions based on current market movements is a losing strategy for intraday traders.

Recommended Stories

جون 12 کو امریکی سیشن کے لیے لیولز اور اہداف کی ایڈجسٹمنٹ

آسٹریلوی اور کینیڈین ڈالرز نے آج کی اوسط تبدیلی کی حکمت عملی کا استعمال کرتے ہوئے اچھی کارکردگی کا مظاہرہ کیا، جبکہ رفتار کی حکمت عملی پونڈ اور یورو

Miroslaw Bawulski 15:27 2025-06-12 UTC+2

یورو / یو ایس ڈی : 10 جون کو ابتدائی تاجروں کے لیے آسان تجارتی تجاویز (امریکی سیشن)

یورو کی تجارت کے لیے تجارتی جائزہ اور سفارشات یہ کہ 1.1398 پر قیمت کا امتحان اس وقت ہوا جب ایم اے سی ڈی اشارے نے ابھی صفر لائن

Jakub Novak 20:55 2025-06-10 UTC+2

جی بی پی / یو ایس ڈی: 10 جون کو ابتدائی تاجروں کے لیے آسان تجارتی تجاویز (امریکی سیشن)

برطانوی پاؤنڈ کی تجارت کے لیے تجارتی جائزہ اور سفارشات پہلے دن میں 1.3530 پر قیمت کا ٹیسٹ ایم اے سی ڈی اشارے کے ساتھ موافق تھا جو ابھی

Jakub Novak 20:50 2025-06-10 UTC+2

یو ایس ڈی / جے پی وائے : 10 جون کو ابتدائی تاجروں کے لیے آسان تجارتی تجاویز (امریکی سیشن)

تجارتی جائزہ اور جاپانی ین کی تجارت کے لیے نکات پہلے دن میں 144.68 کی سطح کا ٹیسٹ اس وقت ہوا جب ایم اے سی ڈی اشارے ابھی بھی سیلنگ

Jakub Novak 20:46 2025-06-10 UTC+2

جی بی پی / یو ایس ڈی: 4 جون کو ابتدائی تاجروں کے لیے آسان تجارتی تجاویز (امریکی سیشن)

تجارتی جائزہ اور برطانوی پاؤنڈ کی تجارت کے لیے تجاویز دن کے پہلے نصف میں 1.3526 پر قیمت کا امتحان اس وقت ہوا جب ایم اے سی ڈی اشارے

Jakub Novak 21:58 2025-06-04 UTC+2

جی بی پی / یو ایس ڈی: 3 جون کو ابتدائی تاجروں کے لیے آسان تجارتی تجاویز۔ کل کی فاریکس ٹریڈز کا جائزہ

برطانوی پاؤنڈ کے لیے تجارت اور تجارتی تجاویز کا تجزیہ دوپہر میں 1.3555 کی سطح کا ٹیسٹ اس وقت ہوا جب ایم اے سی ڈی اشارے پہلے

Jakub Novak 17:40 2025-06-03 UTC+2

یورو / یو ایس ڈی: 3 جون کو ابتدائی تاجروں کے لیے آسان تجارتی تجاویز۔ کل کی فاریکس ٹریڈز کا جائزہ

یورو کے لیے تجارت اور تجارتی تجاویز کا تجزیہ یہ کہ 1.1438 کی سطح پر ٹیسٹ ایم اے سی ڈی اشارے کے صفر کے نشان سے اوپر کی طرف بڑھنے

Jakub Novak 17:31 2025-06-03 UTC+2

یو ایس ڈی / جے پی وائے: 30 مئی (امریکی سیشن) کے لیے ابتدائی تاجروں کے لیے آسان تجارتی تجاویز

تجارتی تجزیہ اور جاپانی ین کی تجارت پر مشورہ دن کے پہلے نصف میں نامزد سطحوں کا تجربہ نہیں کیا گیا تھا۔ ہم 144.17 تک نہیں پہنچے، اور اگر ہمارے

Jakub Novak 16:30 2025-05-30 UTC+2

مئی 26کو ہونے والے یو ایس سیشن کے لیے لیول اور ٹارگٹ ایڈجسٹمنٹس

یورو میں تیزی سے گراوٹ اور پاؤنڈ میں معمولی حرکت کے پیش نظر، دونوں میں سے کسی ایک کے لیے میان ریورژن حکمت عملی استعمال کرنا مناسب نہیں تھا۔

Miroslaw Bawulski 15:12 2025-05-26 UTC+2

جی بی پی / یو ایس ڈی: 8 مئی کو ابتدائی تاجروں کے لیے آسان تجارتی تجاویز۔ کل کی فاریکس ٹریڈز کا جائزہ

برطانوی پاؤنڈ کے لیے تجارت اور تجارتی تجاویز کا تجزیہ دن کے دوسرے نصف حصے میں 1.3359 قیمت کی سطح کا امتحان ایم اے سی ڈی اشارے کے ساتھ مطابقت

Jakub Novak 16:38 2025-05-08 UTC+2
ابھی فوری بات نہیں کرسکتے ؟
اپنا سوال پوچھیں بذریعہ چیٹ.
 

Dear visitor,

Your IP address shows that you are currently located in the USA. If you are a resident of the United States, you are prohibited from using the services of InstaFintech Group including online trading, online transfers, deposit/withdrawal of funds, etc.

If you think you are seeing this message by mistake and your location is not the US, kindly proceed to the website. Otherwise, you must leave the website in order to comply with government restrictions.

Why does your IP address show your location as the USA?

  • - you are using a VPN provided by a hosting company based in the United States;
  • - your IP does not have proper WHOIS records;
  • - an error occurred in the WHOIS geolocation database.

Please confirm whether you are a US resident or not by clicking the relevant button below. If you choose the wrong option, being a US resident, you will not be able to open an account with InstaTrade anyway.

We are sorry for any inconvenience caused by this message.