
یہ بھی دیکھیں


 27.10.2026 03:00 PM
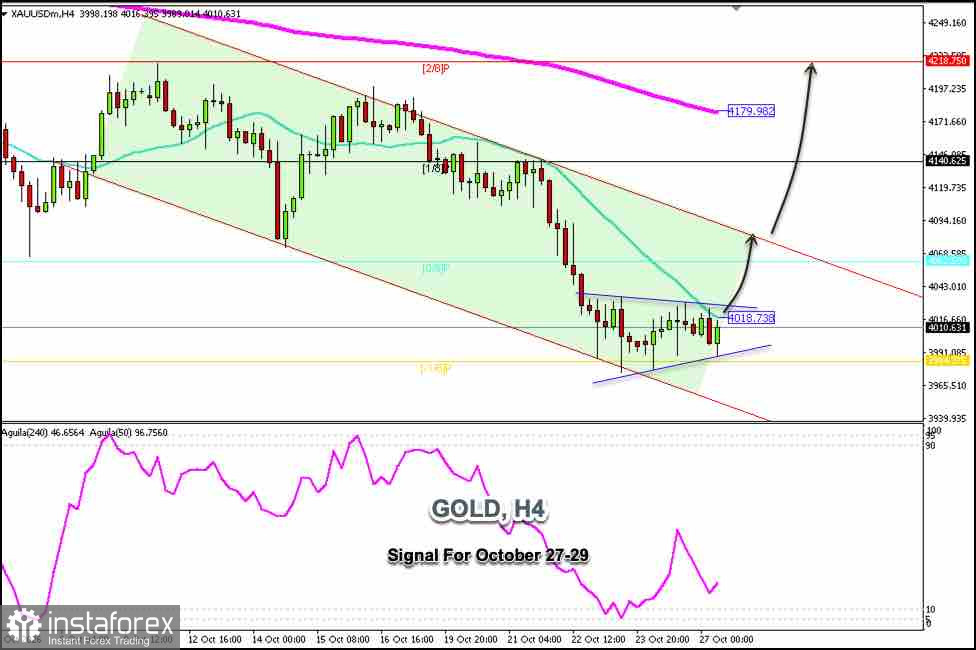
Gold is trading around $4,010 within a downtrend channel that has been forming since early October and within a symmetrical triangle pattern, showing signs of consolidation after repeatedly reaching the -1/8 Murray zone.
If gold manages to break out to the upside and consolidate above the 21-period simple moving average (SMA) and above the triangle pattern, this could be considered a buy signal for gold in the coming hours, with targets at the 0/8 Murray level around $4,062; ultimately, we expect it to reach the upper band of the downtrend channel, around $4,075.
A decisive break above the downtrend channel and consolidation above $4,080 could change the outlook for gold, and we could expect it to quickly reach the 200-day moving average, around $4,179, and ultimately reach the 2/8 Murray level, around $4,218.
We should also note that gold left a gap around $4,289 on September 23. So, it is likely that if the price of gold breaks above the 200-day EMA, the outlook could be positive, and we could expect it to reach these price levels in the coming days or weeks.
Conversely, if gold falls below $3,994—around -1/8 Murray—we should remain vigilant, as the price could find strong support near the lower band of the downtrend channel at $3,945.
Given that gold has reached overbought levels and is technically showing positive signals, we could try to buy in the coming hours above the psychological level of $4,000 or above $3,994—always with a stop-loss below the monthly low and a take-profit target for the swing trade around $4,218.
You have already liked this post today
*تعینات کیا مراد ہے مارکیٹ کے تجزیات یہاں ارسال کیے جاتے ہیں جس کا مقصد آپ کی بیداری بڑھانا ہے، لیکن تجارت کرنے کے لئے ہدایات دینا نہیں.


