
یہ بھی دیکھیں


 13.11.2026 01:32 PM
The one-hour (H1) chart for Crude Oil (#CL) shows a bullish intraday price trend. The price is currently trading at 88.18, holding above the daily pivot level and maintaining recent gains following a strong rebound from previous lows. There is an ongoing effort to confirm the upward trajectory and overcome short-term corrective pressures.
Technical Analysis and Price Action
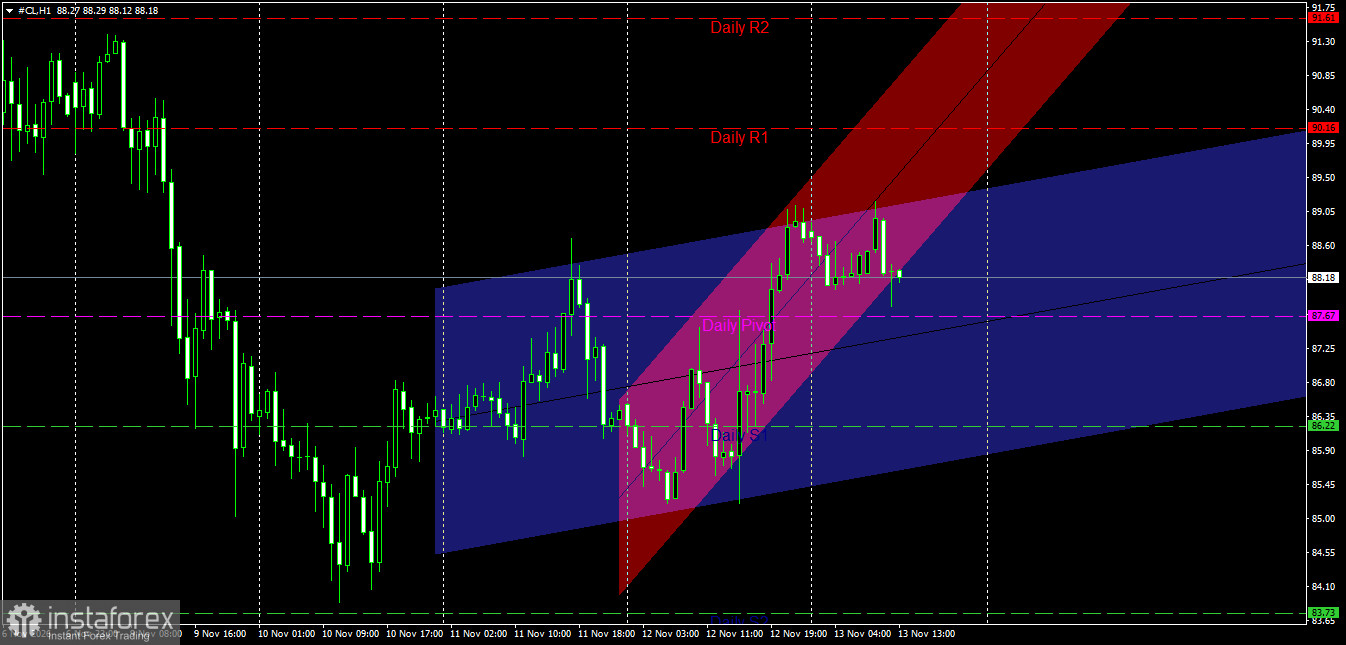
Price Channel Structure: The price is moving within a primary, moderately sloped ascending channel (in blue), which reflects a gradual recovery. Intersecting this is a secondary, steeply sloped ascending channel (in red) that drove the recent bullish surge toward a local peak near 89.10. Currently, the price is testing the lower boundary of the red channel following a period of mild profit-taking; however, it remains positioned within the upper half of the primary blue channel, suggesting an attempt to establish a new base for further upward movement.
Interaction with Daily Pivot Levels: The price has successfully broken above the daily pivot point at 87.67 and has managed to stabilize there. This positive positioning above the pivot gives buyers (bulls) a clear advantage in controlling the current session, paving the way for a retest of the recent intraday high, with the potential to subsequently target the first daily resistance level (Daily R1) at 90.16.
Key Support and Resistance Levels Key Resistance Levels:
First Resistance: 89.05 – 89.15 (the most recent intraday high and the upper boundary of the main channel).
Second Resistance: 90.16 (the first daily resistance level, Daily R1, and a significant psychological barrier).
Pivotal Resistance: 91.61 (the second daily resistance level, Daily R2, and the extended upper boundary of the ascending channel).
Key Support Levels:
First Support: 87.67 (the daily pivot point and the threshold for the intraday trend).
Second Support: 86.22 (the first daily support level, Daily S1, and the midline of the ascending channel).
Pivotal Support: 83.73 (the second daily support level, Daily S2, and an area of previous major lows).
Price Action Outlook and Trading Recommendations:
Bullish Scenario (Primary):
A positive trajectory is the most likely outcome, provided the price remains stable above the daily pivot point of 87.67 and stays within the boundaries of the main ascending channel.
Recommendation: It is advisable to enter long positions during any mild corrective pullback toward the 87.80 – 88.00 range, as long as the key support/anchor zones remain intact.
Technical Targets: Aim to retest the intraday high at 89.10, followed by an extension toward the first daily resistance level at 90.16. Bearish Scenario (Alternative):
This scenario is triggered if selling pressure returns and the price fails to maintain its position above the pivot point, potentially leading to a deeper corrective wave.
Confirmation Condition: A clear hourly candle close below the daily pivot level of 87.67.
Technical Targets: A decline toward the first daily support level at 86.22, followed by a move toward the lower boundary of the channel, near 85.00.
Risk Management:
Crude oil trading is characterized by rapid movement and sharp volatility around pivot points and price channels. Therefore, it is essential to strictly adhere to capital management rules—risking no more than 2% of the total portfolio on any single trade—and to consistently employ stop-loss orders to protect the account against any sudden reversals.
the price on the daily chart for crude oil:
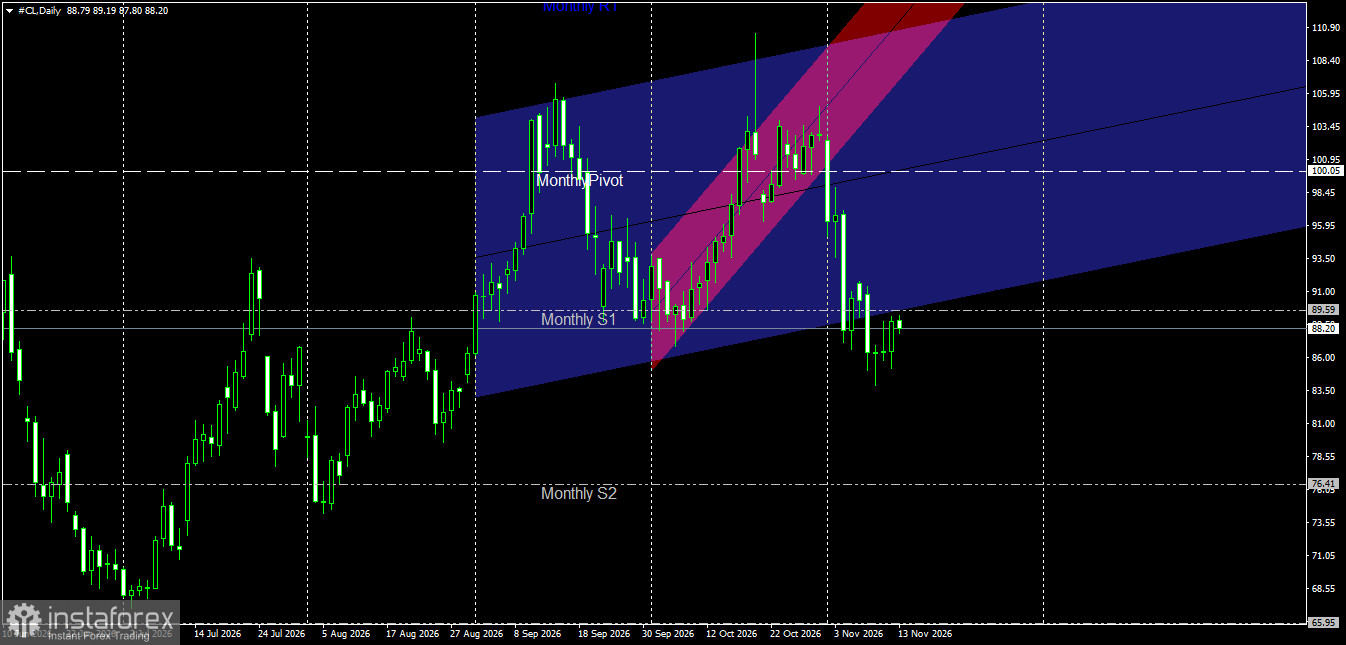
The price is currently trading at 88.20 levels near the lower border of the ascending channel and the first monthly support levels (Monthly S1) at 89.59, recording serious attempts to build a support base and return to stability within the range of ascending channels.
Analysis of the last two candles (yesterday and today's candle):
Yesterday's candle: It reflected attempts at a positive rebound and absorbing part of the previous selling pressure near the bottoms.
Today's candle: It shows the continued pursuit of consolidation and an attempt to break through the 88.20 areas to regain positive momentum and return to trading within the ascending channel.
Forecast of upcoming movement:
Positive (rebound) scenario: It is activated if the price succeeds in stabilizing above the current support levels and breaching the 89.59 level (Monthly S1) again, which paves the way to return within the ascending channels and target the resistance levels and proximity to the monthly pivot point at 100.05.
Negative scenario (alternative): It continues if selling pressure returns and attempts to return to the channel fail, which pushes the price to record an additional decline towards the next support levels at 76.41 (Monthly S2).


