یہ بھی دیکھیں

 10.10.2025 11:04 AM
Trend Analysis (Fig. 1).
On Friday, from the level of 1.3300 (yesterday's daily candle close), the market may continue to move downward toward the target of 1.3232 – a historical support level (blue dotted line). When testing this level, a pullback upward is possible with a target of 1.3278 – the 76.4% retracement level (yellow dotted line).
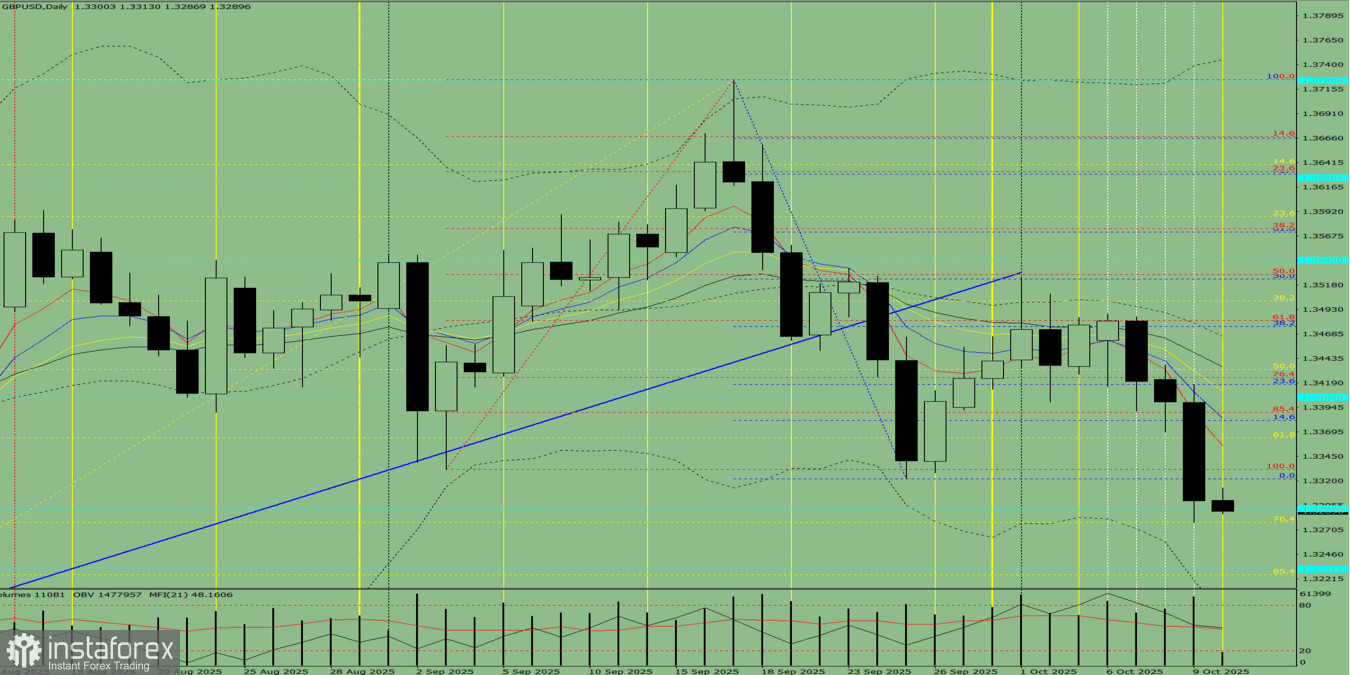
Fig. 1 (daily chart).
Comprehensive Analysis:
General conclusion: downward trend.
Alternative scenario: From the level of 1.3300 (yesterday's daily candle close), the price may continue to move downward toward the target of 1.3226 – the 85.4% retracement level (yellow dotted line). When testing this level, a pullback upward is possible with a target of 1.3278 – the 76.4% retracement level (yellow dotted line).
You have already liked this post today
*تعینات کیا مراد ہے مارکیٹ کے تجزیات یہاں ارسال کیے جاتے ہیں جس کا مقصد آپ کی بیداری بڑھانا ہے، لیکن تجارت کرنے کے لئے ہدایات دینا نہیں.


