یہ بھی دیکھیں

 17.04.2026 11:51 AM
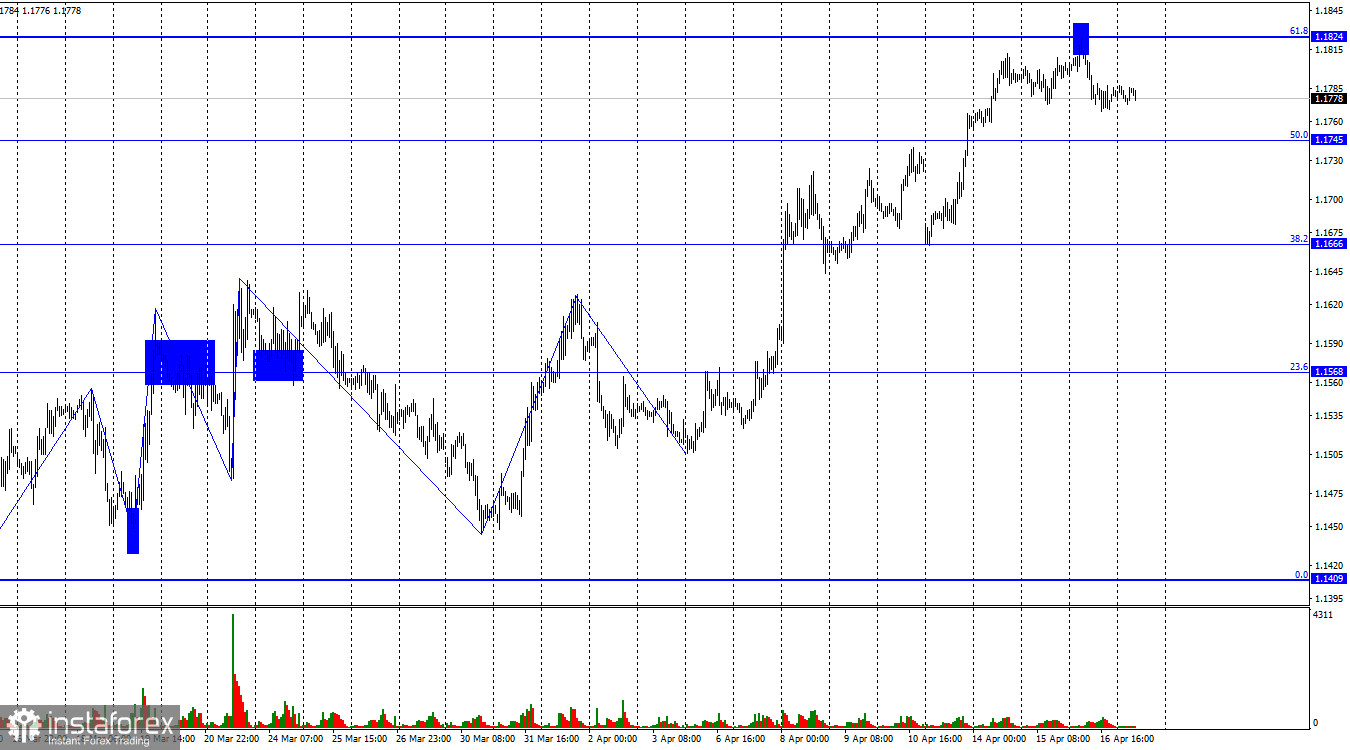
The EUR/USD pair continued its downward movement on Thursday toward the 50.0% Fibonacci retracement level at 1.1745 after rebounding from the 61.8% Fibonacci level at 1.1824. Thus, bearish pressure may continue today. A rebound from the 1.1745 level would favor the euro and some upward movement toward 1.1824. A consolidation below 1.1745 would increase the likelihood of further decline toward the next corrective level at 38.2% – 1.1666.
The wave structure on the hourly chart has become quite complex but is starting to clarify. A two-week ceasefire between Iran and the United States supported the bulls, allowing them to form a new bullish wave. The picture now resembles the beginning of a new bullish trend. Over the weekend, geopolitics turned negative again as negotiations in Islamabad failed; however, the ceasefire is still in effect, and talks may resume this week. That said, there is no confidence in the success of the next round.
There were few significant global events on Thursday, and traders largely ignored the Eurozone inflation report, as they have many other reports in recent weeks. Market attention remains fully focused on geopolitics. The recent slowdown in trading activity does not mean that the Middle East is no longer of interest to the market. At present, everyone is waiting for the next round of negotiations between Iran and the US. It could have taken place yesterday, but there are still no confirmed dates or deadlines for the second meeting in Pakistan. Some sources suggest that talks may occur as early as next week. However, the two-week ceasefire is set to expire next Wednesday. Neither Washington nor Tehran wants to return to hostilities, so the temporary truce will most likely be extended for another two weeks. In my view, the probability of a successful outcome from the negotiations is quite low, but at the same time, if both sides saw no point in meeting, such meetings would not take place at all. It is worth noting that we likely receive no more than 20% of the available information, so it is difficult to speak confidently about the prospects of the negotiations. Two weeks ago, the world was preparing for a new escalation, but instead, Trump announced a ceasefire.
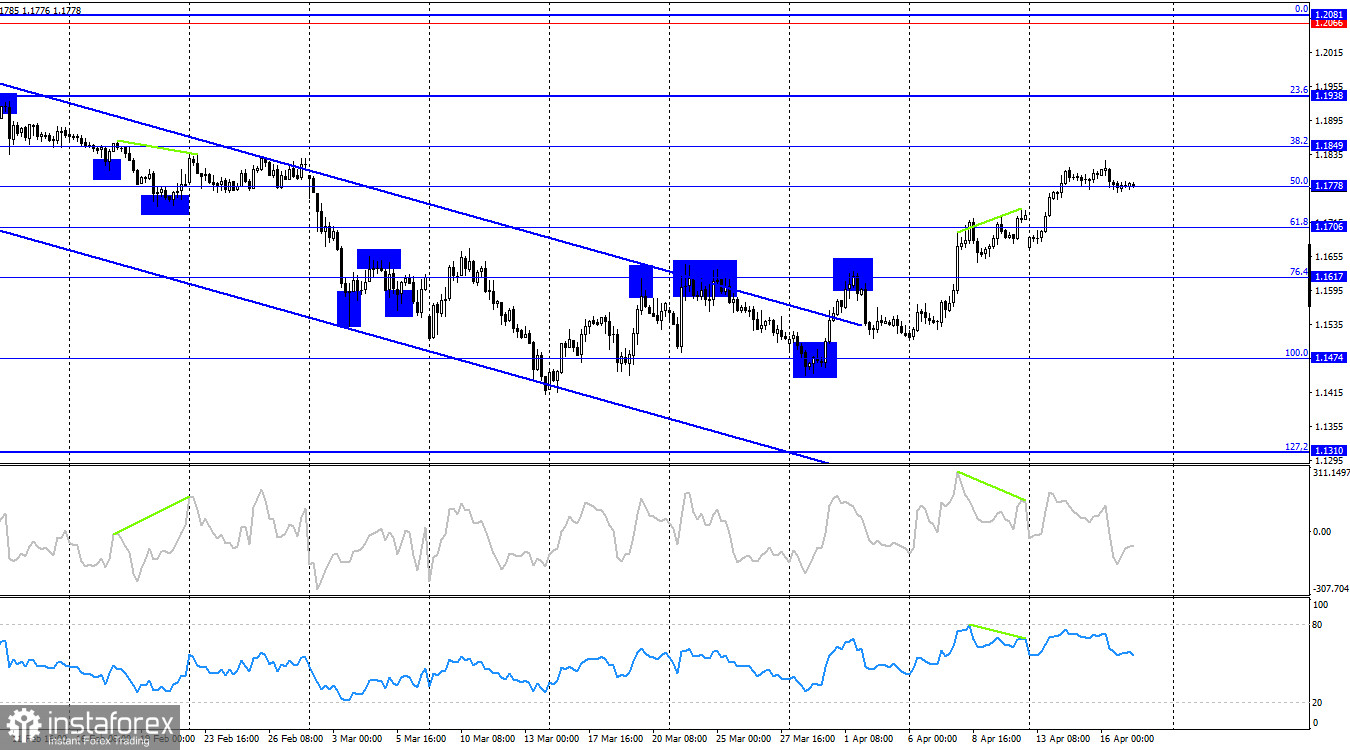
On the 4-hour chart, the pair has consolidated above the 50.0% retracement level at 1.1778, allowing traders to expect further growth toward the next Fibonacci level at 38.2% – 1.1849. A consolidation below 1.1778 would favor the US dollar and lead to some decline toward 1.1706 and 1.1617. Bulls have managed to break out of the descending trend channel, opening up solid prospects. There are currently no emerging divergences.
Commitments of Traders (COT) Report:
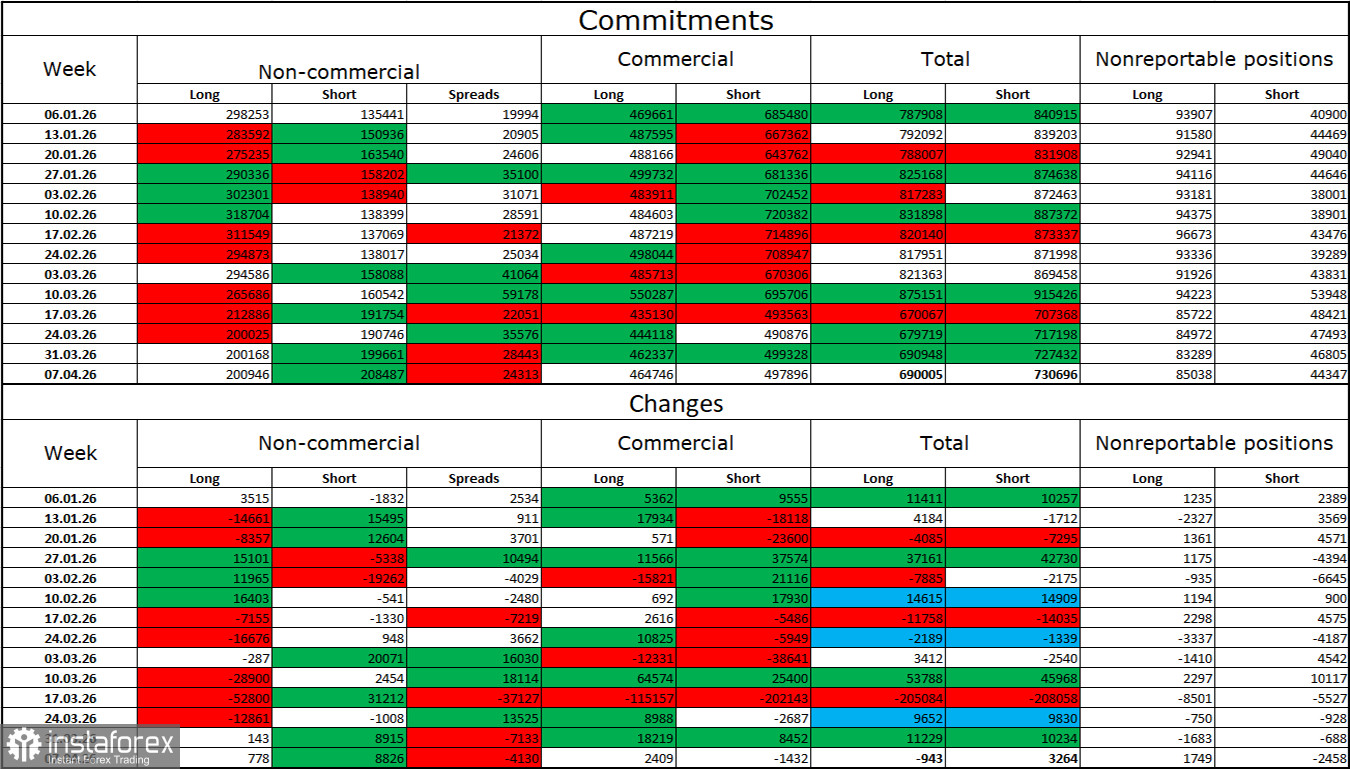
During the last reporting week, professional traders opened 778 long positions and 8,826 short positions. Over the past seven weeks, the bulls' overall advantage has disappeared. The total number of long positions held by speculators now stands at 201,000, while short positions total 208,000. Two months ago, the bulls' advantage among non-commercial traders was more than double.
Overall, in the long term, large players continue to show strong interest in the euro. However, global developments—of which there has been no shortage in recent years—continue to influence investor sentiment. In particular, market attention remains focused on the Middle East, where the conflict shows no sign of ending. Therefore, in the near term, the euro and dollar exchange rates will depend not on Federal Reserve or ECB monetary policy or economic data, but on the war in Iran. The dollar may once again benefit from this situation.
Economic Calendar for the US and Eurozone:
On April 17, the economic calendar contains no notable entries. The influence of the news background on market sentiment on Friday will again be absent.
EUR/USD Forecast and Trading Tips:
Selling positions were possible after a rebound from the 1.1824 level on the hourly chart with a target of 1.1745. These trades can still be held today. I recommend considering buy positions after a rebound from the 1.1745 level with a target of 1.1824.
Fibonacci levels are drawn from 1.2082 to 1.1410 on the hourly chart and from 1.1474 to 1.2082 on the 4-hour chart.


