
یہ بھی دیکھیں


 31.08.2026 09:43 AM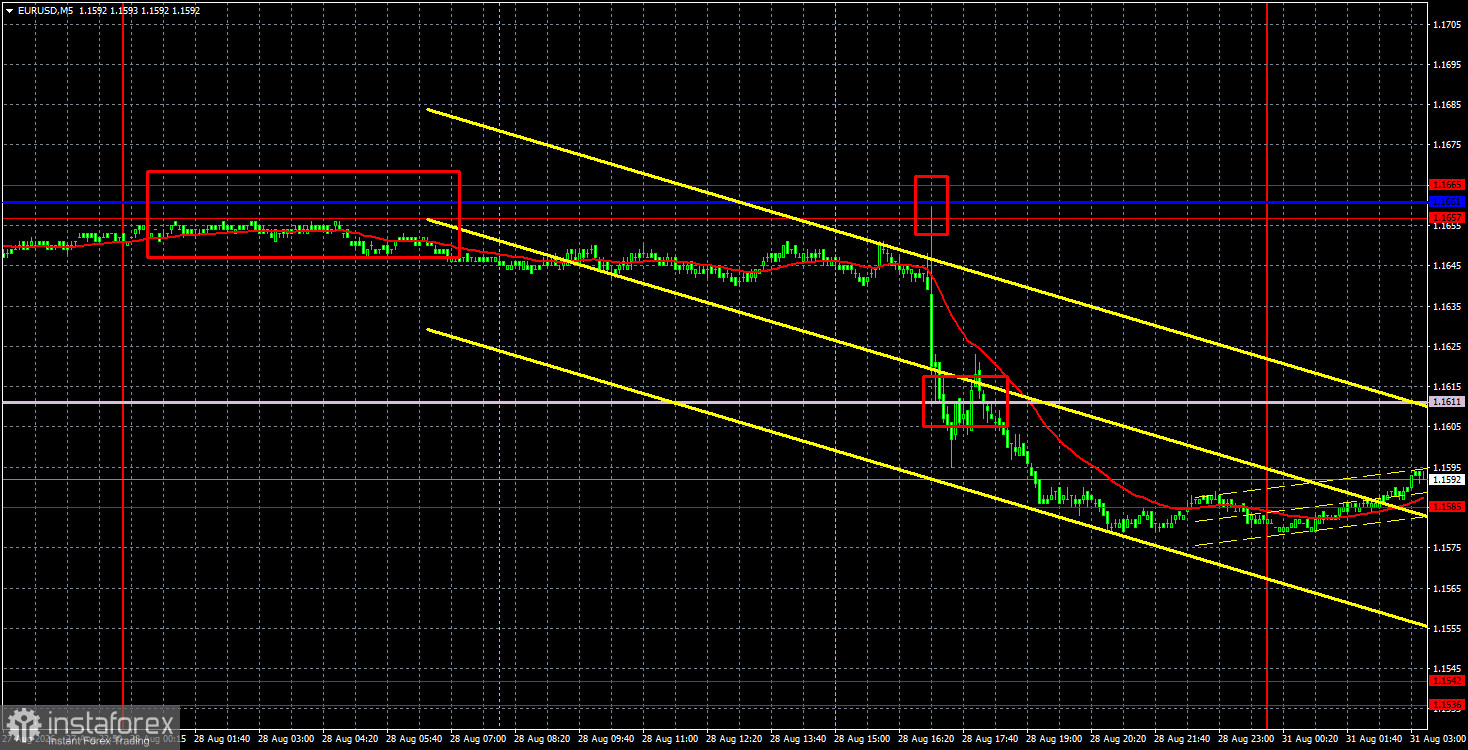
The EUR/USD currency pair showed quite a strong decline on Friday, and we have already discussed the reasons for this in our fundamental articles. To put it succinctly, completely neutral or even negative events for the dollar were interpreted by the market as favorable for the dollar. As it turns out, in August 2026, a negative annual Nonfarm Payrolls report can be considered positive if it is not too shocking. Traders have become accustomed to the fact that the U.S. labor market is so weak that a loss of 79,000 jobs is even viewed as a positive, because it could have been much worse. It is worth noting that this week a new August Nonfarm report will be released, along with a whole batch of important data on business activity, unemployment, and inflation. It is essential to start with inflation, as it is currently a priority for the European Central Bank in determining monetary policy. On Monday, the consumer price index will be released in Germany, and on Tuesday in the European Union. In both cases, inflation is expected to accelerate, so the ECB's outlook may become much more "hawkish" ahead of the September meeting. This is excellent news for the European currency, as unlike the Federal Reserve, the ECB can indeed raise rates for the second time.
From a technical standpoint, the pair has entered a new downward trend after breaching the ascending trend line, as well as the Senkou Span B and Kijun-sen lines, which is clearly visible on the hourly timeframe. Therefore, the pair might continue to fall in the near future. This week, a lot of important data will be published in both the U.S. and the Eurozone, so the pair may change direction several times.
On the 5-minute timeframe, three sell signals were formed on Friday. The first two signals were rebounds from the 1.1657-1.1665 area, reinforcing each other and allowing traders to open short positions. During the American session, the Senkou Span B line was also breached, allowing traders to hold shorts until reaching 1.1585.
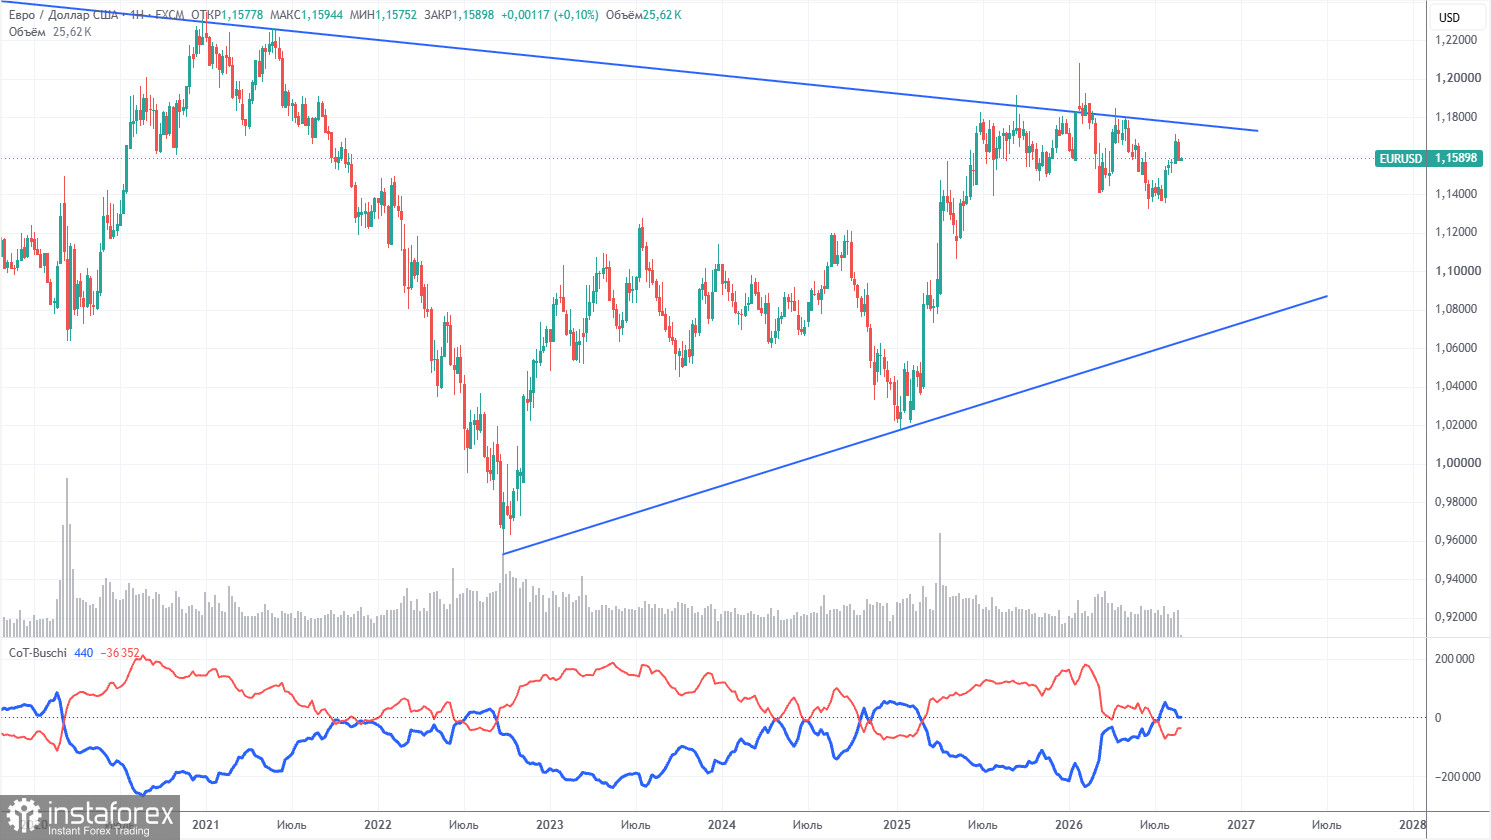
The latest COT report is dated August 25. On the weekly timeframe illustration, it is clear that the net position of non-commercial traders has turned "bearish" and has significantly decreased in 2026 due to geopolitical events. Traders have been getting rid of the European currency in favor of the U.S. dollar in recent months. Donald Trump's policy has not changed, but for a time, the dollar has served as a "reserve currency."
We still see no fundamental factors that would strengthen the American currency. The war in the Middle East made the dollar temporarily very attractive, but once this factor reaches its "expiration date," everything will return to normal. This process may have already concluded. In the long term, the euro could fall as low as the 1.08$ level (trend line), but the upward trend will remain relevant. Over the past months of dollar growth, the pair has not approached this line significantly.
The position of the red and blue lines of the indicator indicates an approximate parity between bulls and bears. Over the last reporting week, the number of longs in the "Non-commercial" group increased by 2,700, while the number of shorts decreased by 20,000. Consequently, the net position increased by 22,700 contracts during the week.
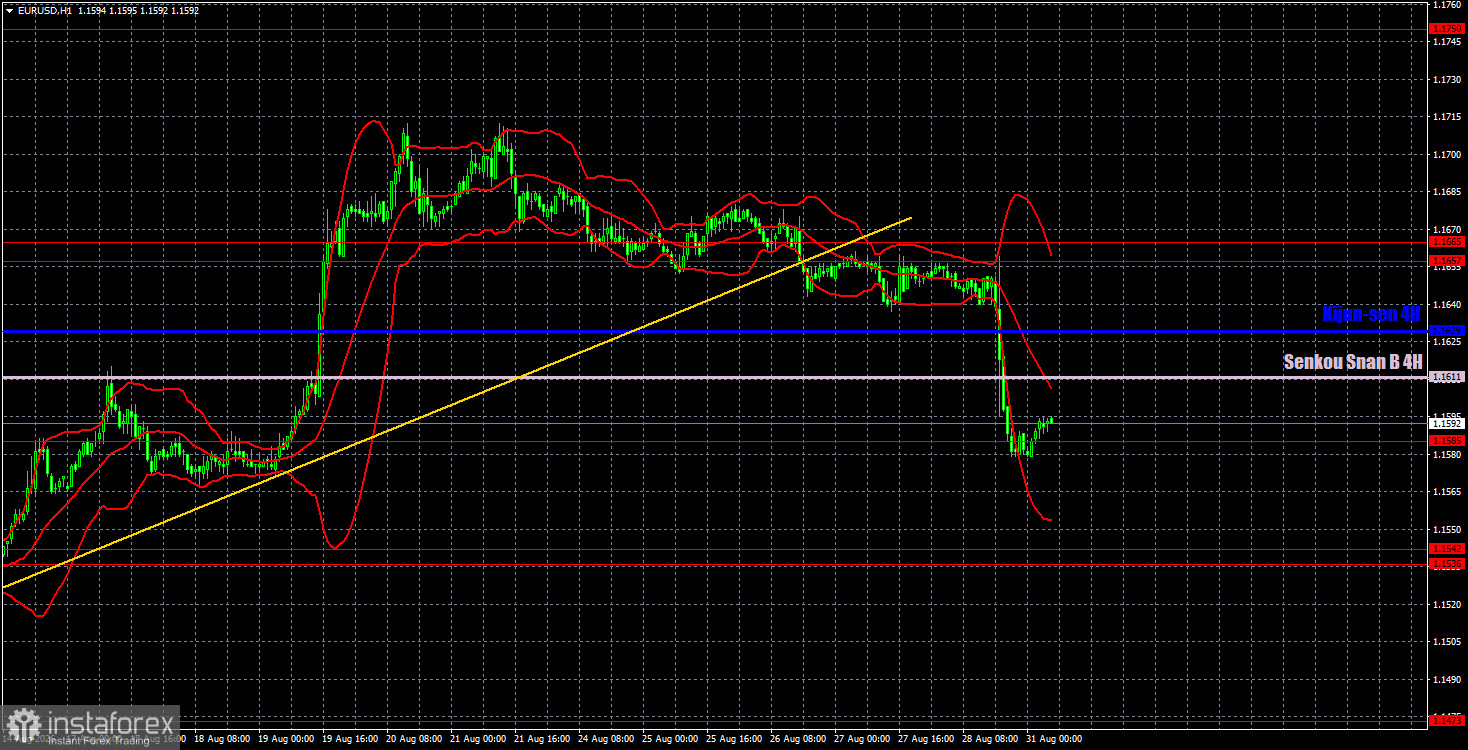
On the hourly timeframe, the pair ended its upward trend on Friday. The situation in the Middle East remains tense and has not improved, but this is not enough for new, strong dollar gains. Kevin Warsh's speech and the annual Nonfarm Payrolls report supported the dollar, but we do not see any significant reasons for optimism or excellent prospects for the American currency. This week, the U.S. data might halt the dollar's growth.
For August 31, we highlight the following levels for trading — 1.1234, 1.1274, 1.1362-1.1368, 1.1461-1.1473, 1.1536-1.1542, 1.1585, 1.1657-1.1665, 1.1750-1.1760, 1.1786, 1.1830-1.1837, as well as the Senkou Span B line (1.1611) and Kijun-sen (1.1629). The lines of the Ichimoku indicator may move throughout the day, which should be considered when determining trading signals. Don't forget to set a stop-loss order to break even if the price moves in the correct direction by 15 pips. This will protect against potential losses if the signal proves false.
On Monday, Germany will release the consumer price index for August, which could help forecast inflation in the Eurozone. An increase in inflation (especially above forecasts) could trigger a rise in the euro currency.
Today, traders may consider short positions targeting 1.1536-1.1542 if the price settles below 1.1585. A price rebound from the level of 1.1585 will allow for the opening of long positions, but the trend has already shifted downward, with two strong resistances above in the form of Ichimoku indicator lines.
Support and resistance price levels are thick red lines where movement may conclude. They are not sources of trading signals.
The Kijun-sen and Senkou Span B lines are Ichimoku indicator lines transferred to the hourly timeframe from the 4-hour timeframe. They are strong lines.
Extreme levels are thin red lines from which the price has previously rebounded. They are sources of trading signals.
Yellow lines indicate trend lines, trending channels, and any other technical patterns.
Indicator 1 on COT charts shows the size of the net position of each category of traders.


