
یہ بھی دیکھیں


 19.10.2026 12:29 PM
Bitcoin managed to avoid losses on the scale of those seen in US stock indices. However, outflows from dedicated exchange-traded funds continue, while Strategy risks losing its place in the MSCI index due to new rules. This could trigger a sell-off in the company's shares, reduce its resources, and curb the activity of one of the largest buyers of digital assets.
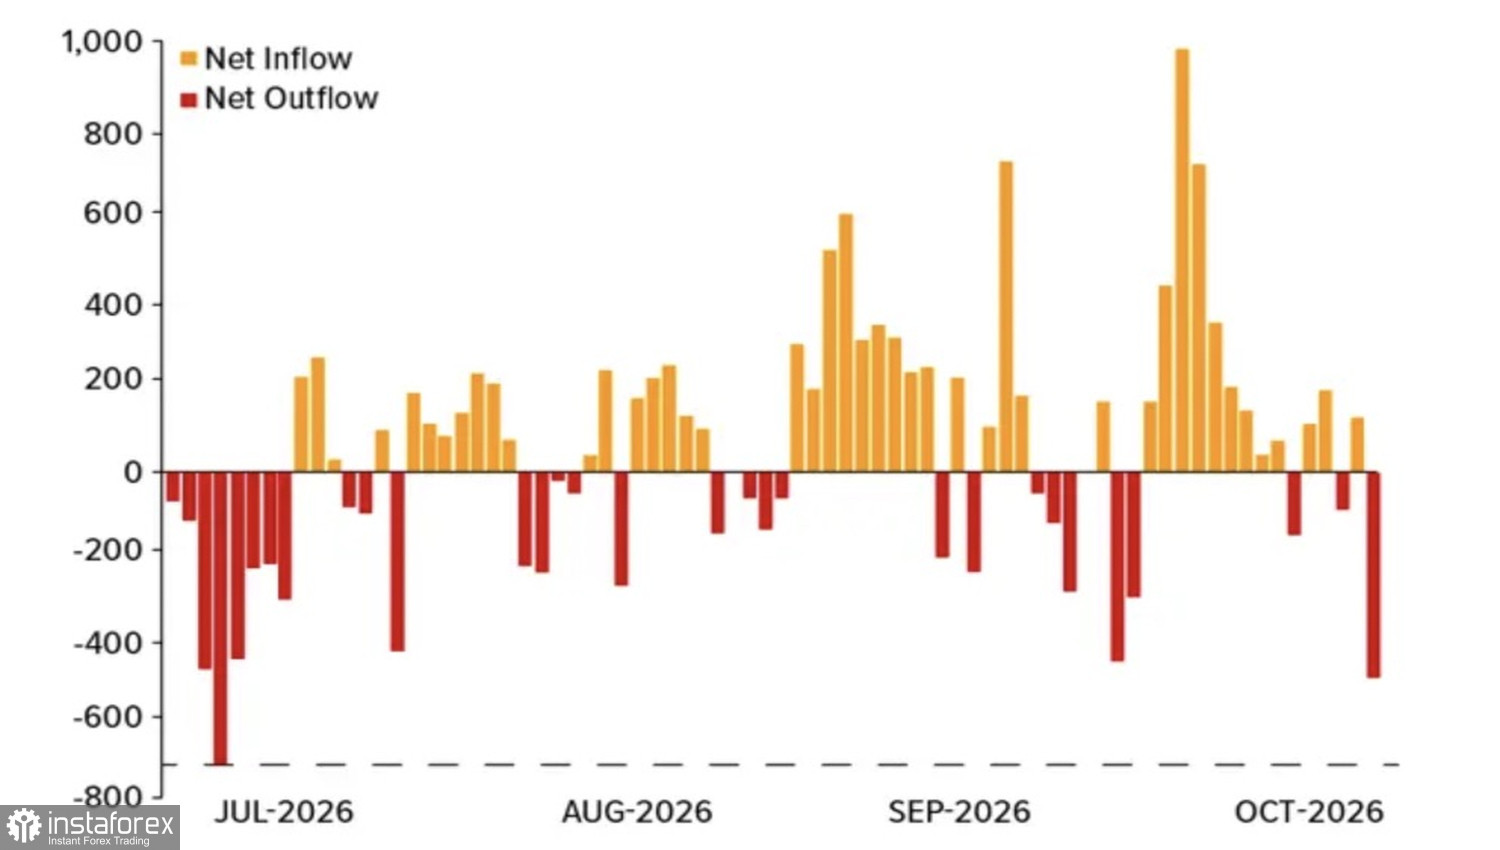
What drives Bitcoin's price movements? For a long time, BTC/USD moved in tandem with US stock indices, responding to changes in global risk appetite. In recent days, the token's correlation with the Nasdaq 100 has begun to increase, while ETF outflows of $228.6 million in the week ending October 17 and $681 million in the preceding five-day period confirm that the relationship remains intact.
Bitcoin ETF Capital Flow Trends
Block Scholes believes that Bitcoin has regained its status as digital gold. Its price movements now mirror those of the precious metal more closely than those of any other asset. The correlation between the two has risen to its highest level since November 2020, when fiscal and monetary stimulus measures introduced in response to the pandemic swept across financial markets. The similar response of both assets to the so-called debasement trade also supports this theory. A loss of confidence in government-issued currencies and bonds increases demand for decentralized financial assets.
Gold struggled for much of the autumn amid the Federal Reserve's hawkish rhetoric. However, the fact that strong US inflation data for September failed to increase the likelihood of a federal funds rate hike in October was welcomed by XAU/USD.
Bitcoin Drawdown Trends
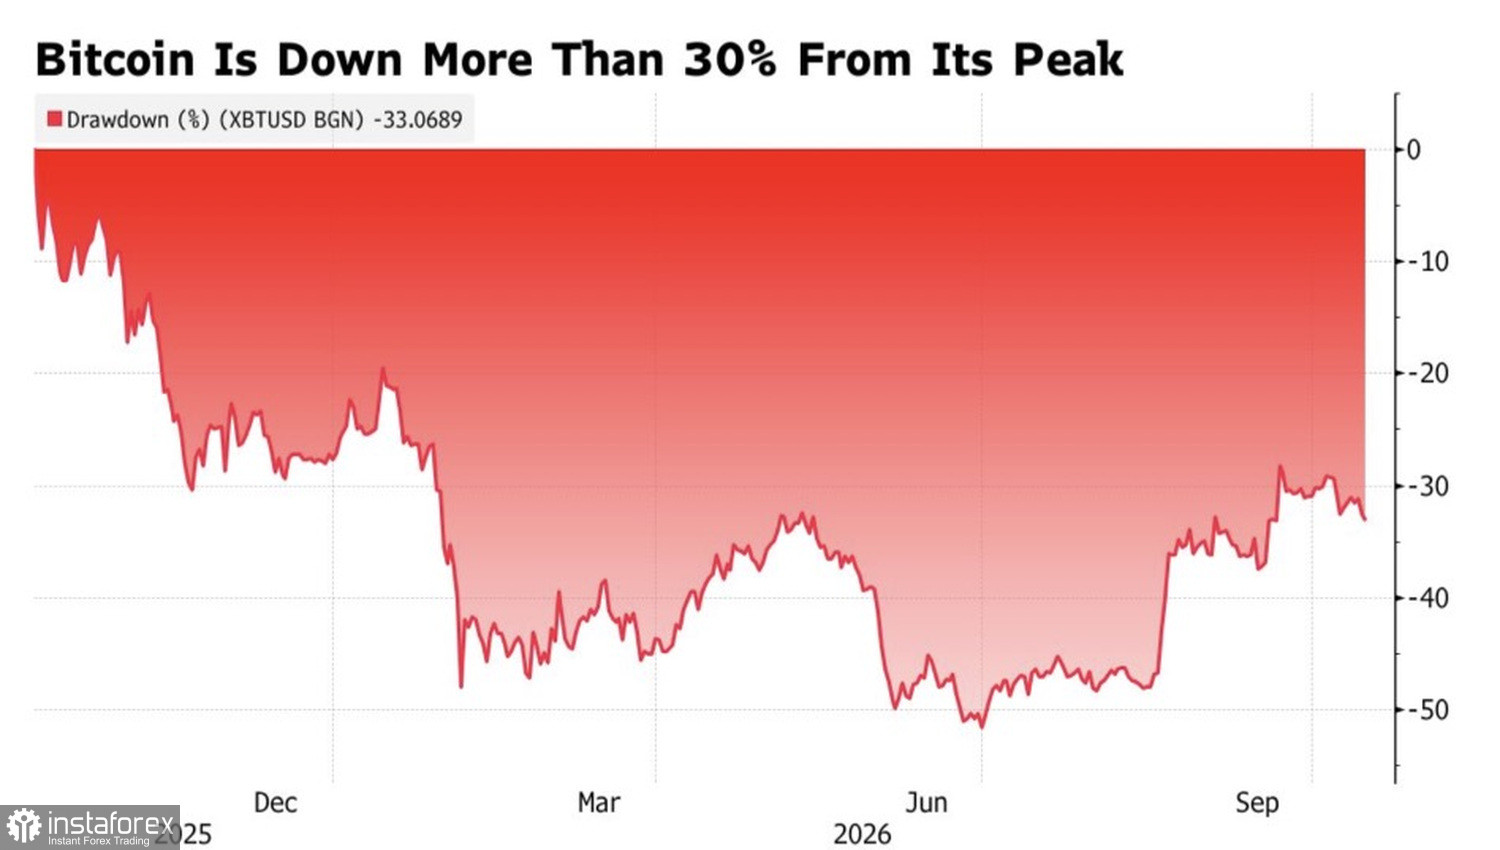
Bitcoin behaved differently. Since June, its drawdown from the record highs reached in October 2025 has begun to narrow, despite a rally in US Treasury yields and the US dollar.
Formally, the trigger for BTC/USD to rebound from its local low at the beginning of the week leading up to October 23 was Brent's inability to hold above the psychologically important level of $110 per barrel. The North Sea benchmark was last seen at that level in May. As a result, investors began to question whether high inflation would persist and whether the Federal Reserve would continue its aggressive monetary tightening cycle. This provided support for both gold and its digital counterpart.
It is reasonable to assume that BTC/USD is benefiting from a weaker US dollar, as cryptocurrency is traded in the US currency. This is consistent with the view that Bitcoin is competing with artificial intelligence technologies for resources. As a result, the Nasdaq 100 sell-off proceeded at a faster pace than the decline in the token.
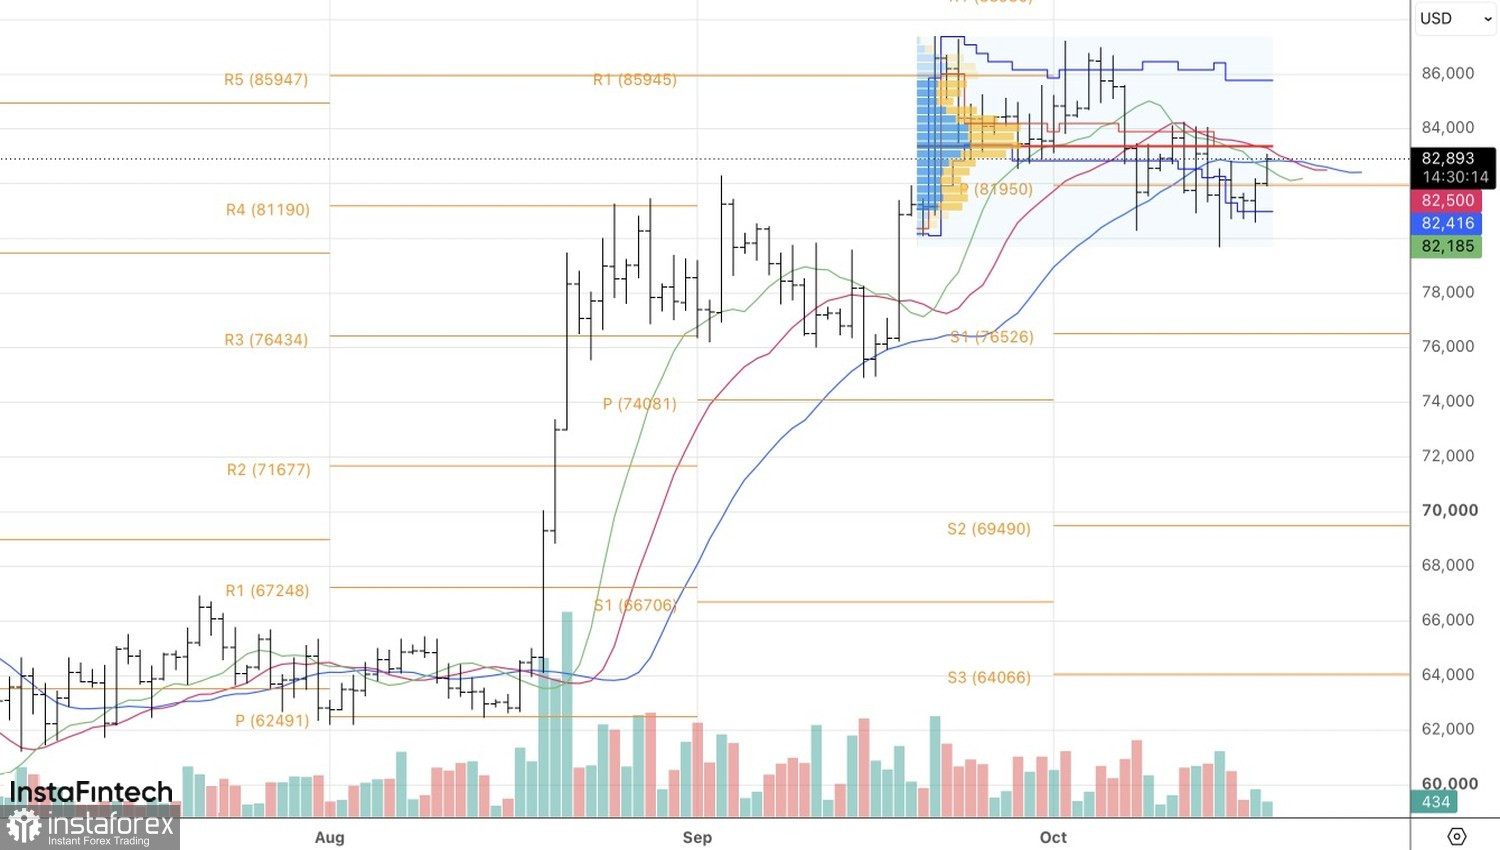
Technically, the daily BTC/USD chart shows an attempt by the bulls to return the price to its fair value of 83,300. A successful break above this level would signal that the corrective move is losing momentum and provide a basis for opening long positions in Bitcoin. Conversely, a rejection at this level would indicate that consolidation is likely to continue.


