
یہ بھی دیکھیں


 04.11.2026 09:12 AM
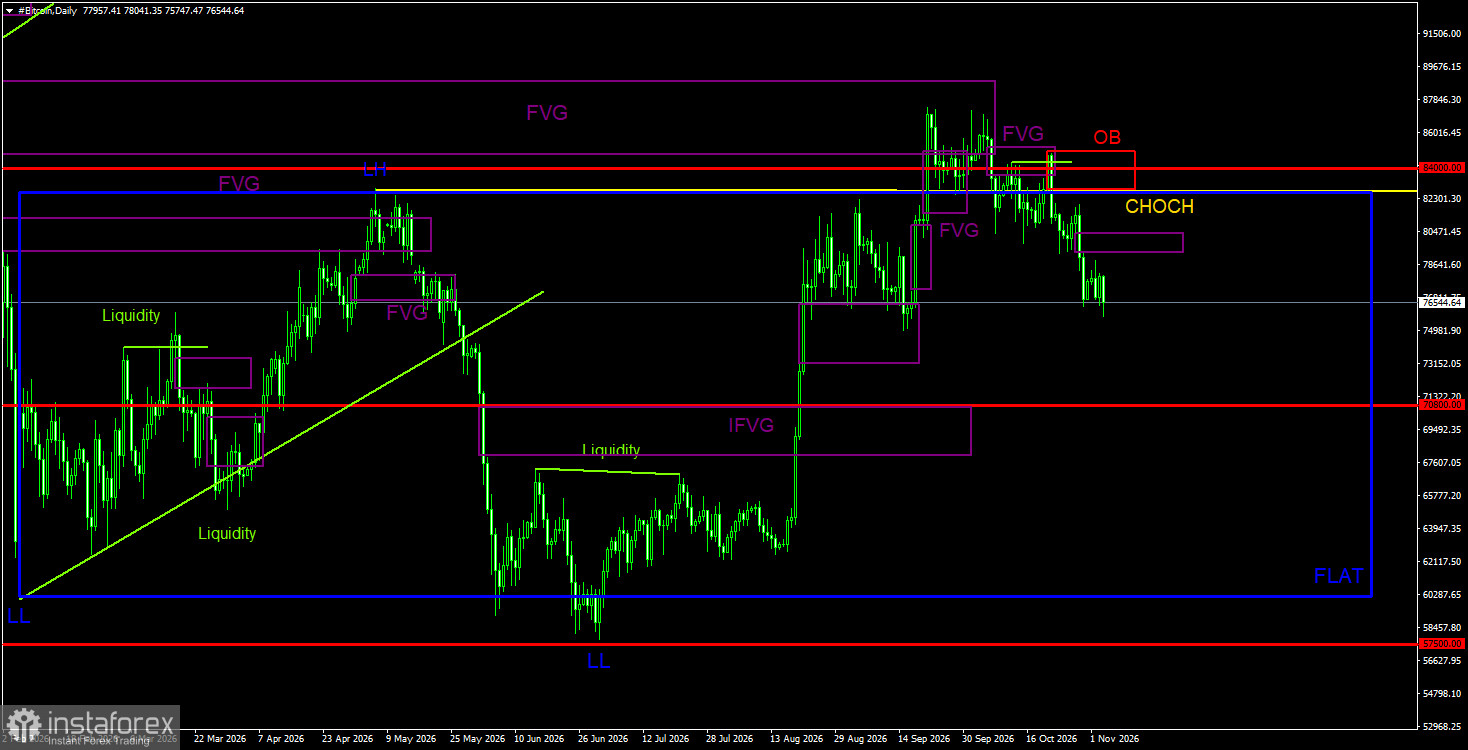
Bitcoin and Ether continue their downward move, repeatedly fed by new discouraging news. Recall that recent developments for the crypto world have been broadly negative. Central banks—notably the Fed—continue to tighten monetary policy, which raises demand for safe assets rather than Bitcoin. The Clarity Act remains only a bill. Democrats may win the U.S. Congressional elections, which would further reduce the odds that the Clarity Act becomes law. Historically, Bitcoin has fallen after U.S. midterms. Last week the list of headwinds grew with the hack of the world's largest crypto exchange, Binance. Taken together, the fundamentals for further growth in the crypto market remain, to put it mildly, doubtful. We do not deny that the asset can rally in any news environment—the recent dollar rally proves that—but at present there are no technical signals or fundamental reasons to expect a sustainable rise.
Before October, the vast majority of traders expected growth. The rationale was simple: historically October is a positive month for "digital gold." However, October 2026 became Bitcoin's worst October in the past 12 years. The leading cryptocurrency lost more than 7%. Note that in recent months many "experts" repeatedly pointed to ETF demand recovery. In reality, funds flowed out of ETF instruments. Experts also note that each time after U.S. midterms in the last three cases, Bitcoin fell in Q4. In 2014 it dropped 17%, in 2018—43%, and in 2022—15%. This is also a historical pattern: the correlation between midterms and Bitcoin's price is clearly more convincing than between October and Bitcoin's price.
Thus, November could bring losses. At present we see no reasons or grounds for a rise in the leading cryptocurrency. Price has returned to a sideways channel; there are no bullish patterns and no removal of bullish liquidity. As for experts' opinions, you will not see anything new here. Those who have predicted Bitcoin's rise for years continue to do so under any circumstances and current trend. Other experts point out that Bitcoin could reasonably slide to $70,000 by year-end.
Trading recommendations for BTC/USD:
Bitcoin attempted to start a new uptrend, but the fundamental backdrop, spot demand, and recent news are too weak to count on continuation. On the daily timeframe, Bitcoin may remain in decline because the price reacted to the two recent bearish FVGs and formed a bearish order block. A move outside the sideways channel on the daily chart is currently interpreted as a deviation. Thus, Bitcoin produced a reversal signal and set course for $70,800. Because a flat does not guarantee the end of the primary trend, we do not believe the bearish trend is over. Short positions are the most relevant in the near term.
Trading recommendations for ETH/USD:
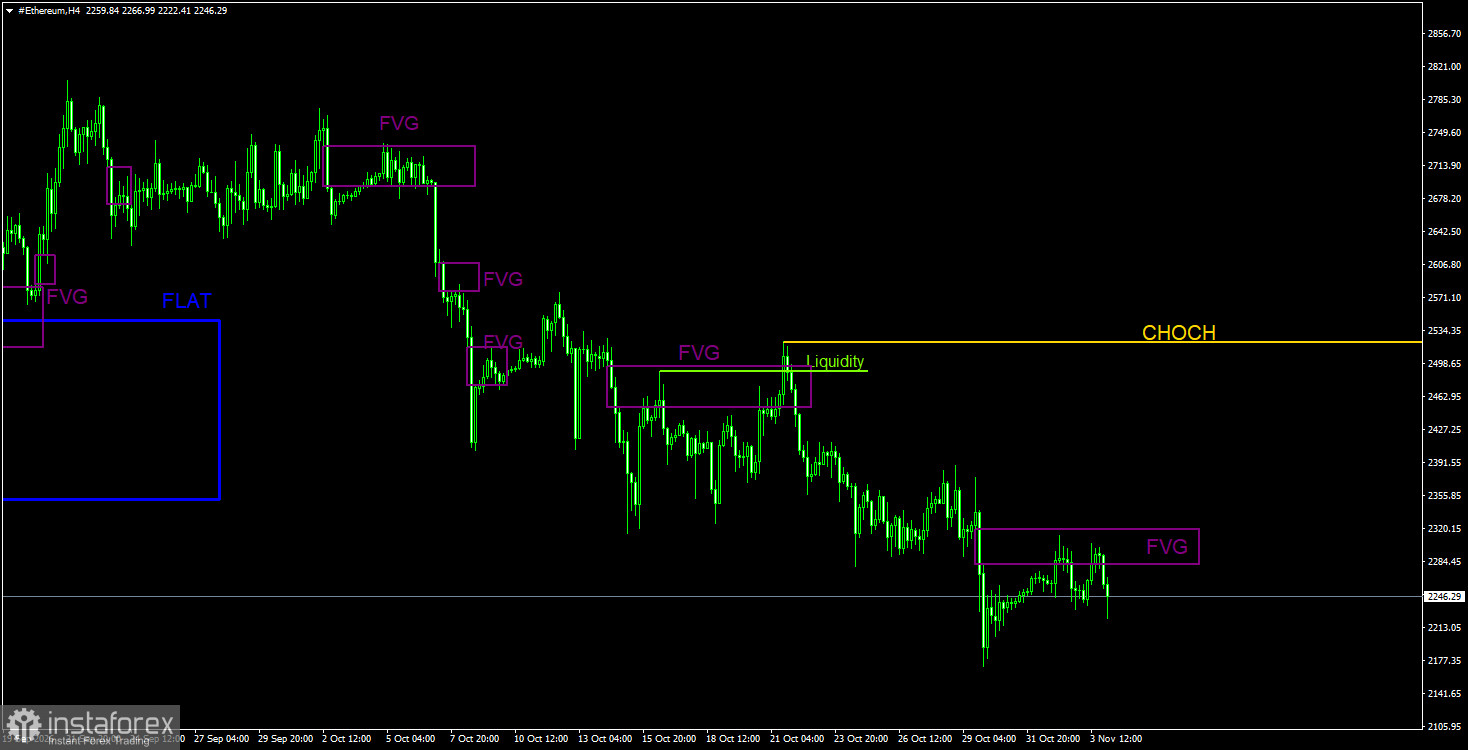
The daily technical picture for Ether has changed. Ether made a significant upward impulse in June–September 2026 that could be the start of a new long-term trend. However, at the same time, there is no confidence that Bitcoin's bear market is finished. If Bitcoin remains in a downtrend or even a flat, do not expect Ether to rise. Bulls can rely only on the weekly chart, where Ether is heading to $4,800, the upper boundary of a five-year sideways channel. However, on the daily chart, Bitcoin has generated enough sell signals and bearish patterns to continue falling. Therefore, we also expect Ether to decline. Targets are near $1,850 and $1,391. On the 4-hour timeframe there may be a reaction to the last bearish FVG.
Explanations for illustrations:
- CHOCH—change of trend structure.
- Liquidity—liquidity, stop losses, and pending orders that market makers use to build positions.
- FVG—fair value gap. A price inefficiency area that price traverses quickly, indicating the absence of one side of the market; thereafter price tends to return and react to such areas in continuation of the main trend.
- IFVG—inverted fair value gap. After returning to such an area, the price often does not react but impulsively breaks through and then tests from the other side.
- OB—order block. The candle where a market maker opened a position aiming to take liquidity to form a position in the opposite direction.


