
یہ بھی دیکھیں


 13.11.2026 06:11 AM
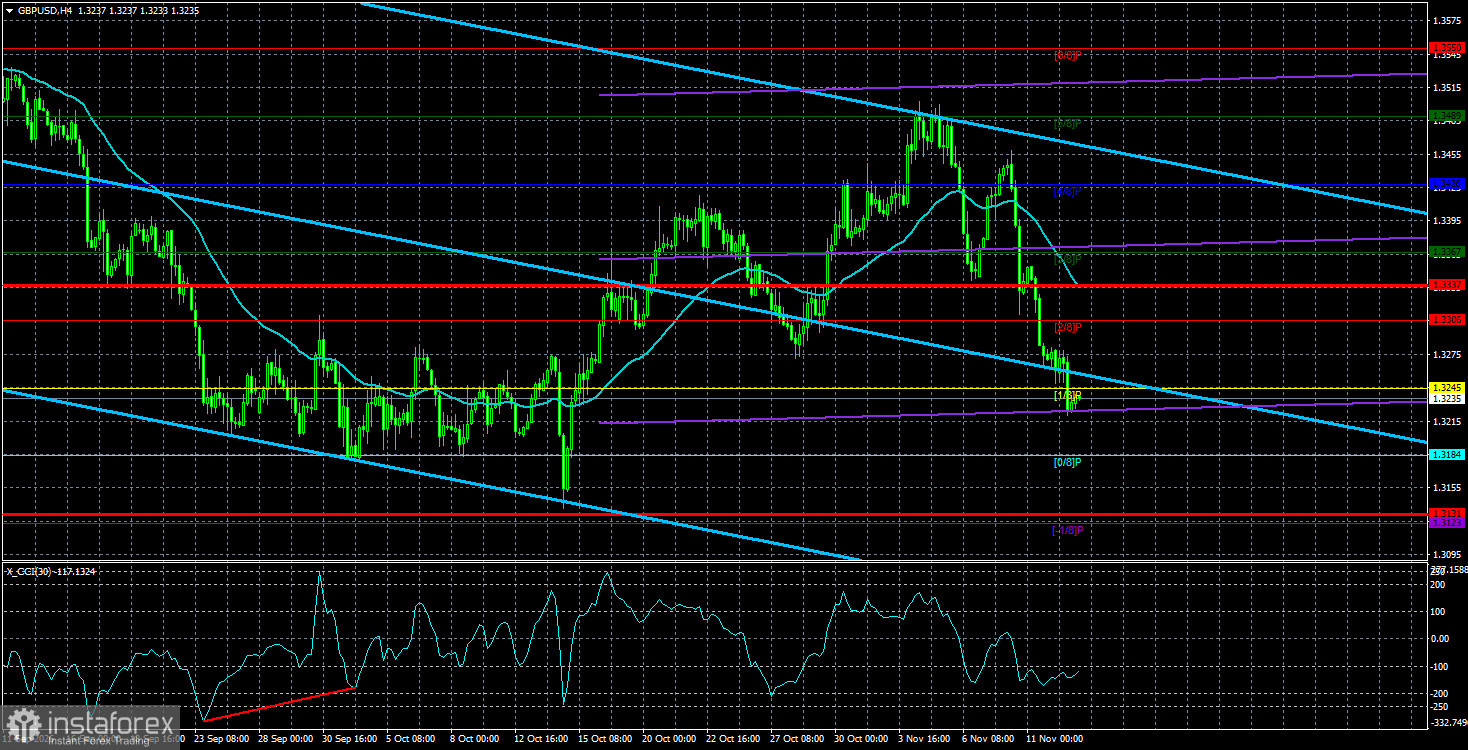
The GBP/USD pair also kept a downward bias on Thursday, continuing the tone of recent days. Recall that sterling had treated traders well in recent weeks with logical moves that matched fundamentals and the technical picture on higher timeframes. However, late last week the euro "infected" the pound. This week, a report that had no bearing on the Federal Reserve's December decision—a report that didn't even publish year-on-year figures markets and central banks usually rely on —triggered nearly a 200-pip rise in the US dollar. We are talking about US inflation. Does anyone remember the last time the dollar rose for two days after an inflation report? And what about the Fed's "favorite" inflation gauge, the PCE?
Yes, inflation came in slightly above forecasts, but only month-on-month. October's CPI therefore could not have changed the Fed's December decision — and indeed practically all FOMC officials had already indicated a second tightening was coming in December. The Fed has repeatedly signaled it is prepared to tighten at roughly every second meeting. So the fact that inflation was a touch above forecasts changes nothing in substance.
Yes, the Fed could raise rates once or twice more next year. But wasn't that the market's expectation since the summer? Did anyone really expect the Fed to stop after one or two hikes and immediately return inflation to 2%? Recall too that nearly all commentators have recently emphasized the strength of the US economy and labor market, which gives the Fed confidence to tighten further. Yesterday morning UK GDP reports were released: the UK economy grew 0.7% quarter-on-quarter and 1.9% year-on-year in Q3 — well above Q2 — and September growth was 0.2%, beating forecasts. Thus, the UK economy is also showing solid results, which should give the Bank of England room to tighten policy further; the BoE, having just begun raising rates, could raise its key rate at least four times.
What was sterling's reaction to these UK data? None. The market kept buying the US dollar, because the UK economy and monetary-policy prospects are as uninteresting to the market now as euro-area data and European Central Bank prospects. In recent weeks the pound traded sensibly and technically, but it may now start to resemble the euro. In effect, over three days the pound fell back to the area from which it began its rise after bounces off the lower edges of the daily and weekly sideways channels a few weeks ago. The market can quite easily continue buying the dollar today. On Friday, the US Producer Price Index (PPI) will be released, and if it prints even 0.1% above forecasts, everyone understands what will happen to the dollar... The pound remains range-bound on the weekly chart, but that flat will end sooner or later. Right now the price is, for the fourth time, racing toward the lower boundary of that channel across many pairs...
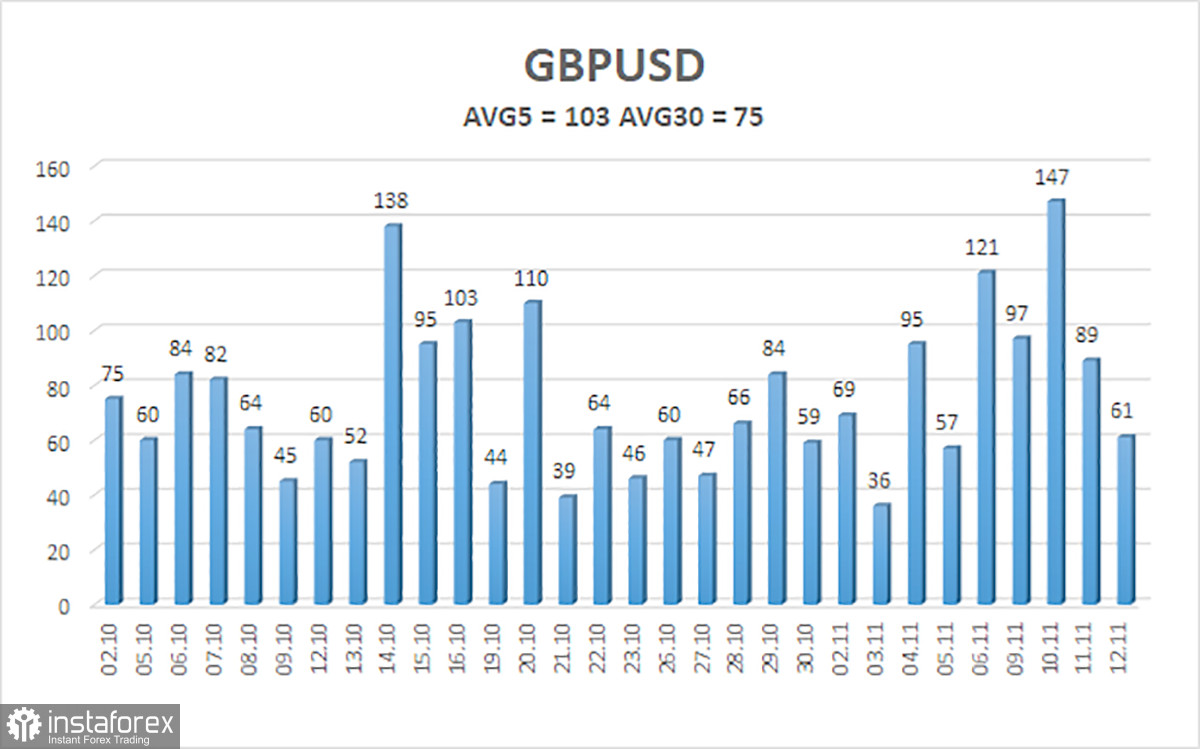
The average volatility of the GBP/USD pair over the last 5 trading days is 103 pips. For the pound/dollar pair, this value is characterized as "average." On Friday, November 13, we therefore expect movement within a range bounded by 1.3131 and 1.3337. The major linear-regression channel is pointing down, indicating a downtrend. The CCI indicator has not recently entered overbought/oversold areas or formed divergences.
S1 – 1.3184
S2 – 1.3123
S3 – 1.3062
R1 – 1.3245
R2 – 1.3306
R3 – 1.3367
The GBP/USD pair has entered a new downward trend within the daily-timeframe sideways channel. The year 2026 has been extremely positive for the dollar due to geopolitics and inflation, which drove capital to safety and prompted the Fed to return to monetary tightening. However, on the weekly timeframe, price remains flat between 1.3150 and 1.3780 within a four-year uptrend, supporting expectations of sterling appreciation in the medium term. Long positions with targets of 1.3428 and 1.3489 can be considered when price is above the moving average. When price is below the moving average, trade to the downside with targets of 1.3184 and 1.3123.


