Double Top
was formed on 10.04 at 22:00:08 (UTC+0)
signal strength 3 of 5
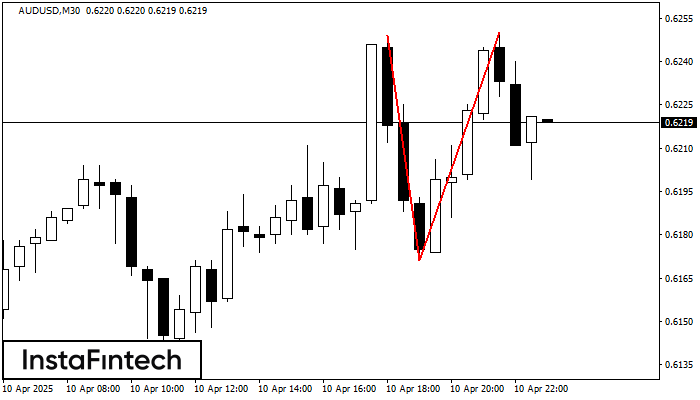
On the chart of AUDUSD M30 the Double Top reversal pattern has been formed. Characteristics: the upper boundary 0.6250; the lower boundary 0.6171; the width of the pattern 79 points. The signal: a break of the lower boundary will cause continuation of the downward trend targeting the 0.6141 level.
یہ بھی دیکھیں
- All
- All
- Bearish Rectangle
- Bearish Symmetrical Triangle
- Bullish Rectangle
- Double Top
- Double Top
- Triple Bottom
- Triple Bottom
- Triple Top
- Triple Top
- All
- All
- Buy
- Sale
- All
- 1
- 2
- 3
- 4
- 5
বিয়ারিশ সিমেট্রিক্যাল ট্রায়াঙ্গেল
was formed on 16.06 at 15:34:09 (UTC+0)
signal strength 2 of 5
M15 এর চার্ট অনুযায়ী, EURCHF বিয়ারিশ সিমেট্রিক্যাল ট্রায়াঙ্গেল প্যাটার্ন গঠন করেছে। ট্রেডিংয়ের পরামর্শ: 0.9356 এর নীচের সীমানা লঙ্ঘন করা হলে নিম্নমুখী প্রবণতা অব্যাহত রাখতে উৎসাহিত করবে।
M5 এবং M15 টাইম ফ্রেমে আরও ভুল এন্ট্রি পয়েন্ট থাকতে পারে।
Open chart in a new window
ডাবল বটম
was formed on 16.06 at 15:29:58 (UTC+0)
signal strength 1 of 5
M5 চার্টে, #KO-এর ডাবল বটম প্যাটার্নটি গঠিত হয়েছে। উপরের সীমানা হল 71.08; নীচের সীমানা হল 70.73। প্যাটার্নের প্রস্থ হল 33 পয়েন্ট। 71.08-এর উপরের সীমানা ভেদ করার ক্ষেত্রে, প্রবণতা পরিবর্তনের পূর্বাভাস
M5 এবং M15 টাইম ফ্রেমে আরও ভুল এন্ট্রি পয়েন্ট থাকতে পারে।
Open chart in a new window
ডাবল বটম
was formed on 16.06 at 15:29:46 (UTC+0)
signal strength 3 of 5
M30 চার্টে, #AAPL-এর ডাবল বটম প্যাটার্নটি গঠিত হয়েছে। উপরের সীমানা হল 198.00; নীচের সীমানা হল 195.73। প্যাটার্নের প্রস্থ হল 213 পয়েন্ট। 198.00-এর উপরের সীমানা ভেদ করার ক্ষেত্রে, প্রবণতা পরিবর্তনের পূর্বাভাস
Open chart in a new window