Double Bottom
was formed on 04.06 at 14:59:57 (UTC+0)
signal strength 4 of 5
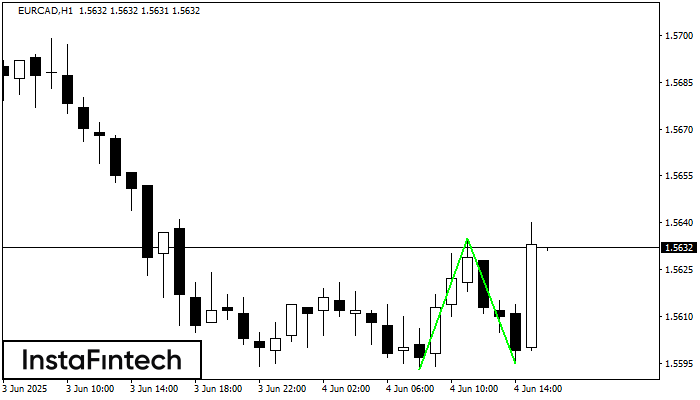
The Double Bottom pattern has been formed on EURCAD H1; the upper boundary is 1.5635; the lower boundary is 1.5595. The width of the pattern is 42 points. In case of a break of the upper boundary 1.5635, a change in the trend can be predicted where the width of the pattern will coincide with the distance to a possible take profit level.
یہ بھی دیکھیں
- All
- All
- Bearish Rectangle
- Bearish Symmetrical Triangle
- Bullish Rectangle
- Double Top
- Double Top
- Triple Bottom
- Triple Bottom
- Triple Top
- Triple Top
- All
- All
- Buy
- Sale
- All
- 1
- 2
- 3
- 4
- 5
ট্রিপল বটম
was formed on 02.09 at 20:15:26 (UTC+0)
signal strength 2 of 5
M15 চার্টে, GBPAUD ট্রেডিং ইন্সট্রুমেন্টের ট্রিপল বটম প্যাটার্ন গঠিত হয়েছে। 2.0586/2.0547 ব্রেকডাউনের ক্ষেত্রে এই প্যাটার্ন নিম্নমুখী প্রবণতা থেকে ঊর্ধ্বমুখী প্রবণতায় পরিবর্তনের সংকেত দেয়৷
M5 এবং M15 টাইম ফ্রেমে আরও ভুল এন্ট্রি পয়েন্ট থাকতে পারে।
Open chart in a new window
ইনভার্স হেড অ্যান্ড শোল্ডার্স
was formed on 02.09 at 18:50:16 (UTC+0)
signal strength 1 of 5
M5 চার্ট অনুযায়ী, GBPCHF-এর ইনভার্স হেড অ্যান্ড শোল্ডার্স প্যাটার্ন গঠিত হয়েছে। হেড 1.0739 -এ নির্ধারণ করা হয়েছে এবং নেকের মিডিয়ান লাইন 1.0758/1.0760 -এ নির্ধারণ করা হয়েছে। ইনভার্স হেড অ্যান্ড শোল্ডার্স
M5 এবং M15 টাইম ফ্রেমে আরও ভুল এন্ট্রি পয়েন্ট থাকতে পারে।
Open chart in a new window
বিয়ারিশ ফ্ল্যাগ
was formed on 02.09 at 18:16:24 (UTC+0)
signal strength 2 of 5
M15 চার্টে GBPAUD-এর বিয়ারিশ ফ্ল্যাগ প্যাটার্ন গঠিত হয়েছে। অতএব, নিকটতম মেয়াদে নিম্নমুখী প্রবণতা অব্যাহত থাকার সম্ভাবনা রয়েছে। যখনই মূল্য 2.0515-এর সর্বনিম্ন স্তরের নীচে ব্রেক করবে, ট্রেডারদের বাজারে প্রবেশ করা উচিত।
M5 এবং M15 টাইম ফ্রেমে আরও ভুল এন্ট্রি পয়েন্ট থাকতে পারে।
Open chart in a new window