Bearish Rectangle
was formed on 18.06 at 20:16:26 (UTC+0)
signal strength 2 of 5
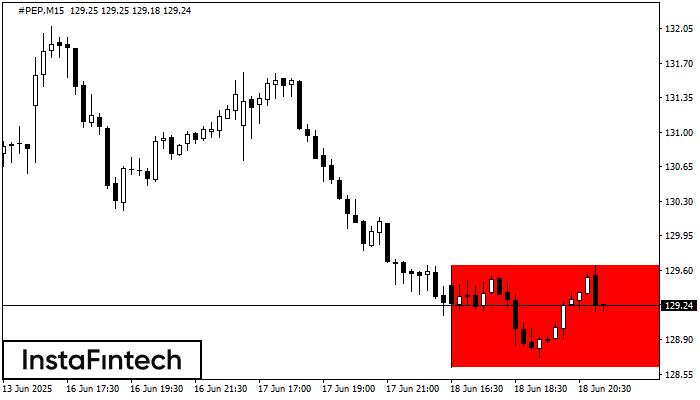
According to the chart of M15, #PEP formed the Bearish Rectangle which is a pattern of a trend continuation. The pattern is contained within the following borders: lower border 128.62 – 128.62 and upper border 129.65 – 129.65. In case the lower border is broken, the instrument is likely to follow the downward trend.
The M5 and M15 time frames may have more false entry points.
یہ بھی دیکھیں
- All
- All
- Bearish Rectangle
- Bearish Symmetrical Triangle
- Bullish Rectangle
- Double Top
- Double Top
- Triple Bottom
- Triple Bottom
- Triple Top
- Triple Top
- All
- All
- Buy
- Sale
- All
- 1
- 2
- 3
- 4
- 5
ডাবল বটম
was formed on 19.08 at 21:25:16 (UTC+0)
signal strength 1 of 5
M5 চার্টে, #TSLA-এর ডাবল বটম প্যাটার্নটি গঠিত হয়েছে। উপরের সীমানা হল 330.61; নীচের সীমানা হল 327.76। প্যাটার্নের প্রস্থ হল 297 পয়েন্ট। 330.61-এর উপরের সীমানা ভেদ করার ক্ষেত্রে, প্রবণতা পরিবর্তনের পূর্বাভাস
M5 এবং M15 টাইম ফ্রেমে আরও ভুল এন্ট্রি পয়েন্ট থাকতে পারে।
Open chart in a new window
বুলিশ ফ্ল্যাগ
was formed on 19.08 at 20:36:58 (UTC+0)
signal strength 1 of 5
M5 চার্টে GBPAUD-এর বুলিশ ফ্ল্যাগ প্যাটার্ন গঠিত হয়েছে। প্যাটার্নের নীচের সীমানা 2.0889/2.0883 -এ অবস্থিত, এবং উপরের সীমানা 2.0893/2.0887 -এ অবস্থিত। ফ্ল্যাগপোলের প্রজেকশন হচ্ছে 12 পয়েন্ট। এই গঠনটি ইঙ্গিত দেয় যে
M5 এবং M15 টাইম ফ্রেমে আরও ভুল এন্ট্রি পয়েন্ট থাকতে পারে।
Open chart in a new window
বুলিশ পেন্যান্ট
was formed on 19.08 at 20:36:53 (UTC+0)
signal strength 1 of 5
M5 চার্টে, GBPAUD-এ বুলিশ পেন্যান্ট প্যাটার্নটি গঠিত হয়েছে। এটি এক ধরনের ধারাবাহিকতার প্যাটার্ন। অনুমিতভাবে, যদি মূল্য পেন্যান্টের সর্বোচ্চ 2.0893 -এর উপরে স্থির হয়, তাহলে আরও ঊর্ধ্বমুখী প্রবণতার সম্ভবনা রয়েছে।
M5 এবং M15 টাইম ফ্রেমে আরও ভুল এন্ট্রি পয়েন্ট থাকতে পারে।
Open chart in a new window