อ่านรายละเอียดเพิ่มเติม
Operational Scale Minute (H4 time frame)
Local US Dollar victory in the battle for metal? Review of options for the movement of Gold & Silver from 13 October 2020.
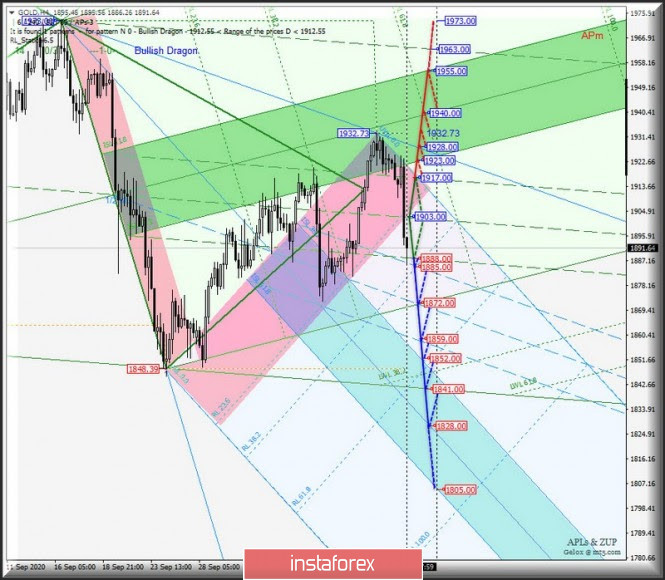
____________________
Spot Gold
The movement of the Spot Gold from October 13 2020 was caused by the breakdown development and the direction of the breakout of the channel borders 1/2 Median Line (1888.00 - 1903.00 - 1917.00) of the Minuette Operational Scale Fork.
Joint breakdown the lower boundary of the 1/2 Median Line channel of the pitchfork of the Minute operating scale - the support level of 1888.00 and the upper boundary of the 1/2 ML Minuette ( 1885.00 ) channel will make the development of the Spot Gold movement within the boundaries of the 1/2 Median Line channel ( 1885.00 - 1872.00 - 1859.00 ) and the zone relevant equilibrium ( 1852.00 - 1828.00 - 1805.00 ) pitchfork operating scale Minuette.
A breakdown of the upper border of the channel 1/2 Median Line Minute - the resistance level of 1917.00 - will direct the development of the Spot Gold movement to the borders of the equilibrium zone (1923.00 - 1940.00 - 1955.00) of the Minuette Operational Scale Fork.
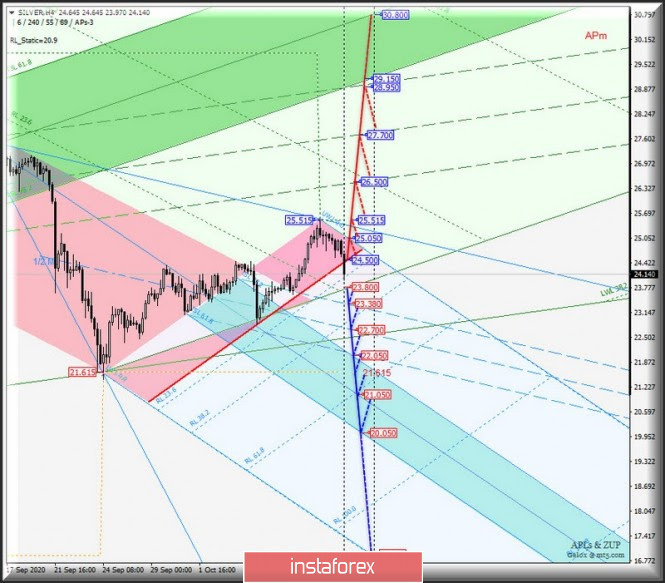
____________________
Spot Silver
From October 13, 2020, the Spot Silver movement will develop depending on the development and direction of the range breakout:
In the event of a breakout of the initial SSL line of the operating scale pitchfork - support level 23.800 - the downward movement of Spot Silver may continue to the boundaries of the 1/2 Median Line channel ( 23.380 - 22.700 - 22.050 ) and the equilibrium zone ( 22.050 - 21.050 - 20.050 ) of the operational scale pitchfork Minuette.
Sequential breakdown of the border red zone fork operational scale Minuette - resistance 24.500 - and the initial line SSL Minuette (25.050), and then updating the local maximum 25.515 will make the actual continuation of the upward movement of Spot Silver to the borders of the channel 1/2 Median Line (26.500 - 27.700 - 28.950) fork operational scale Minute.
____________________
The review is compiled without taking into account the news background, the opening of trading sessions of the main financial centers and is not a guide to action (placing "sell" or "buy" orders).
You have already liked this post today
*บทวิเคราะห์ในตลาดที่มีการโพสต์ตรงนี้ เพียงเพื่อทำให้คุณทราบถึงข้อมูล ไม่ได้เป็นการเจาะจงถึงขั้นตอนให้คุณทำการซื้อขายตาม
เมื่อวันพฤหัสบดี คู่สกุลเงิน EUR/USD ยังคงเคลื่อนไหวขึ้นและยืนเหนือระดับ 100.0% Fibonacci retracement ที่ 1.1574 อย่างไรก็ตาม ในช่วงกลางคืนเกิดการกลับอย่างรวดเร็วสนับสนุนเงินดอลลาร์สหรัฐ โดยมีการทะลุระดับนี้ลงมา และขณะนี้กำลังลดลงไปสู่ระดับ Fibonacci ที่
ในกราฟรายชั่วโมง คู่ GBP/USD ในวันพฤหัสบดีปรับตัวขึ้นจากระดับ 1.3520 พุ่งขึ้นไปยังโซนแนวต้านที่ 1.3611–1.3620 กระดอนจากสองครั้งก่อนที่จะลดลงสู่ระดับฟีโบนักชี retracement ที่ 127.2% ที่ 1.3527 การดีดกลับจากระดับนี้อีกครั้งจะสนับสนุนค่าเงินปอนด์และบ่งบอกถึงการเติบโตเพิ่มเติมไปยังระดับ 1.3611–1.3620
สวัสดีครับ/ค่ะ เทรดเดอร์ทุกท่าน! เมื่อวันพุธที่ผ่านมา คู่เงิน EUR/USD ยังคงเคลื่อนไหวขึ้นต่อเนื่องหลังจากดีดตัวจากโซนสนับสนุนที่ 1.1374–1.1380 โดยสามารถปิดแนวเหนือระดับ Fibonacci retracement ที่ 76.4% ที่ 1.1454 ได้สำเร็จ
สวัสดีครับผู้ค้าทุกท่าน! จากแผนภูมิทุกชั่วโมงในวันพุธ, คู่ GBP/USD ได้เปลี่ยนสภาพง่ายๆ ให้โดยการขยายด้านที่ดีของบาทสหภาพประชาชาติและรวมกันที่ระดับการถอยหลังของฟิโบนัชชี 161.8% ที่ 1.3520. สิ่งนี้เปิดทางให้เกิดการเติบโตเพิ่มเติมสู่โซนการต้านทานที่ 1.3611–1.3620. การสะท้อนกลับไปในโซนนี้จะทำให้เกิดประโยชน์ให้กับดอลลาร์สหรัฐฯและนำไปสู่การถดถอยลงอย่างเล็กน้อยสู่ 1.3520. การรวมกันที่อยู่เหนือโซน 1.3611–1.3620
หากเรามองที่กราฟรายวันของเครื่องประเมินค่าสินค้า Crude Oil จะเห็นได้ว่ามีสภาวะ Divergence ระหว่างการเคลื่อนไหวของราคา #CL กับตัวบ่งชี้ Stochastic Oscillator ซึ่งบ่งชี้ว่ามีความเป็นไปได้ที่ #CL จะเผชิญกับการปรับฐานลงในอีกไม่กี่วันข้างหน้า แต่ตราบที่การปรับฐานไม่ทะลุและปิดต่ำกว่าระดับ 59.86
บนกราฟ 4 ชั่วโมงของดัชนี Nasdaq 100 มีการเบี่ยงเบนระหว่างการเคลื่อนไหวของราคากับตัวบ่งชี้ Stochastic Oscillator อย่างชัดเจน โดยเฉพาะอย่างยิ่งเมื่อนำมารวมกับการยืนยันการเคลื่อนไหวของราคา #NDX ที่กำลังเคลื่อนที่ต่ำกว่า EMA (21) ซึ่งเพิ่มความเป็นไปได้อย่างมากที่ดัชนีอาจอ่อนลงในอนาคตอันใกล้ถึงระดับ
กราฟรายวันแสดงให้เห็นว่า EUR/USD มีการซื้อขายภายในช่องทางขาขึ้นตั้งแต่เดือนกุมภาพันธ์ และมีแนวโน้มที่จะเพิ่มขึ้นต่อเนื่องเพื่อไปถึงระดับสูงสุดในเดือนเมษายนที่ประมาณ 1.1571 ทั้งยังอาจจะสูงถึงระดับ 8/8 Murray ที่ 1.1714 อีกด้วย ดังนั้น การเข้าซื้อคู่เงิน EUR/USD ขณะที่ราคายังคงปรับตัวเหนือค่าเฉลี่ยเคลื่อนที่
แนวโน้มของ XAU/USD ยังคงเป็นขาขึ้นตราบใดที่ราคาคงที่เหนือ 3,331 ดังนั้น จึงควรซื้อทองคำตราบใดที่ราคาคงที่เหนือ 3,359 ซึ่งเป็นตำแหน่งของระดับ 7/8 ของ Murray ความผันผวนของทองคำจะยังคงมีต่อไปในไม่กี่วันข้างหน้า โดยเราคาดว่าราคาจะเคลื่อนไหวระหว่าง 3,386
ข้อมูลเงินเฟ้อของสหรัฐที่เปิดเผยในวันพุธทำให้ตลาดเกิดความเคลื่อนไหว: ดัชนีดอลลาร์ลดลง 0.47%, น้ำมัน WTI พุ่งขึ้น 5.54%, ราคาทองคำเพิ่มขึ้น 1.27%, และอัตราผลตอบแทนพันธบัตรรัฐบาลสหรัฐอายุ 5 ปีลดลงจาก 4.08% เป็น 4.01%
เมื่อวันพุธที่ผ่านมา เงินปอนด์อังกฤษสามารถหลีกเลี่ยงการลงต่ำกว่าระดับแนวรับทางเทคนิคได้อย่างสำเร็จ โดยได้กลับทิศทางขึ้นจากระดับดังกล่าว ราคาฟื้นตัวจากเส้นดัชนี MACD ในกราฟรายวัน ขณะเดียวกัน ตัวบ่งชี้ Marlin ก็ปรับทิศทางขึ้นจากขอบเขตล่างของช่องขาขึ้นของมัน ราคากำลังเคลื่อนไหวไปยังเป้าหมายแรกที่ 1.3635 และเมื่อลงไปถึงต่ำกว่าจุดนี้ จะเคลื่อนไปยังเส้นด้านในของช่องราคาใกล้ 1.3714
สมาชิกInstaForex
Your IP address shows that you are currently located in the USA. If you are a resident of the United States, you are prohibited from using the services of InstaFintech Group including online trading, online transfers, deposit/withdrawal of funds, etc.
If you think you are seeing this message by mistake and your location is not the US, kindly proceed to the website. Otherwise, you must leave the website in order to comply with government restrictions.
Why does your IP address show your location as the USA?
Please confirm whether you are a US resident or not by clicking the relevant button below. If you choose the wrong option, being a US resident, you will not be able to open an account with InstaTrade anyway.
We are sorry for any inconvenience caused by this message.