อ่านรายละเอียดเพิ่มเติม
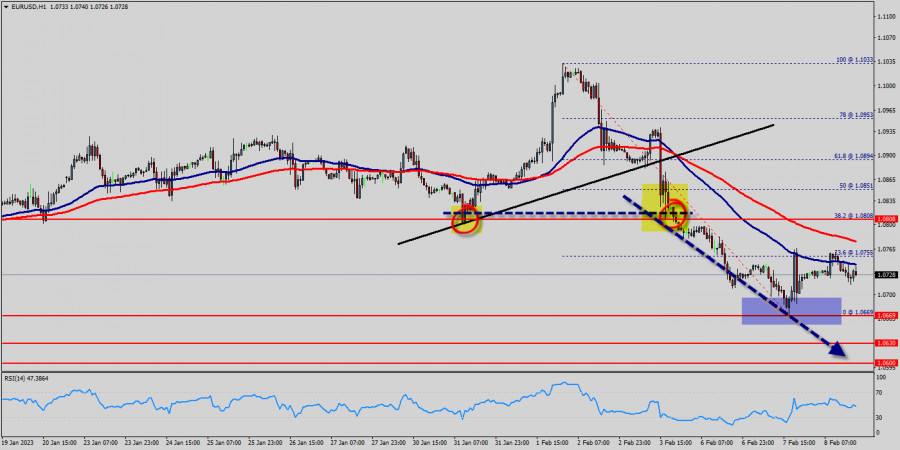
The EUR/USD pair has faced strong resistances at the levels of 1.0880 because support had become resistance last week. So, the strong resistance has been already formed at the level of 1.0880 and the pair is likely to try to approach it in order to test it again. However, if the pair fails to pass through the level of 1.0880, the market will indicate a bearish opportunity below the new strong resistance level of 1.0880 (the level of 1.0880 coincides with a ratio of 38.2% Fibonacci - last bullish wave - double top).
Moreover, the RSI starts signaling a downward trend, as the trend is still showing strength above the moving average (100) and (50). The trend of EUR/USD pair movement was controversial as it took place in the downtrend channel.
Due to the previous events, the price is still set between the levels of 1.0808 and 1.0669, so it is recommended to be careful while making deals in these levels because the prices of 1.0808 and 1.0669 are representing the resistance and support respectively.
Therefore, it is necessary to wait till the downtrend channel is passed through. Then the market will probably show the signs of a bearish market.
It should be noted that the volatility is very high for that the price of the EUR/USD pair is still trading between the prices of 1.0669 and 1.0808 in the coming hours.
Furthermore, the price has been set below the strong resistance at the levels of 1.0808 and 1.0851 which coincide with the 38.2% and 50% Fibonacci retracement levels respectively.
Thus, the market is indicating a bearish opportunity below 1.0808 so it will be good to sell at 1.0808 with the first target of 1.0669.
It will also call for a downtrend in order to continue towards 1.0630. The daily strong support is seen at 1.0600.
However, the stop loss should always be taken into account, for that it will be reasonable to set your stop loss at the level of 1.0851.
Moving averages, in the meantime, maintain their bearish slope way above the current level. Furthermore, although the news is bearish for the EUR/USD pair, professional may not want to sell weakness, but rather following a rebound rally.
Additionally, some aggressive counter-trend buyers may be defending parity. In case a continuousion takes place and the EUR/USD pair breaks through the support level of 1.0669 , a further decline to 1.0600 can occur which would indicate a bearish market.
Signal :
It should be noted that the 1.0808 price will act as a major resistance on Feb. 08th, 2023. Therefore, it will be too gainful to sell short below 1.0808 and look for further downside with 1.0669, 1.0630 and 1.0600 targets. It should also be reminded that stop loss must never exceed the maximum exposure amounts. Thus, stop loss should be placed at the 1.0851 level today.
You have already liked this post today
*บทวิเคราะห์ในตลาดที่มีการโพสต์ตรงนี้ เพียงเพื่อทำให้คุณทราบถึงข้อมูล ไม่ได้เป็นการเจาะจงถึงขั้นตอนให้คุณทำการซื้อขายตาม
ทองคำกำลังปรับตัวลดลงในช่วงวัน ปัจจัยบวกโดยรวมในตลาดหุ้นกำลังลดความต้องการในทองคำแท่ง อย่างไรก็ตาม มีหลายปัจจัยที่ทำให้ตลาดหมีไม่สามารถเข้ายึดพื้นที่ได้อย่างหนักแน่น ช่วยให้ราคาทองคำยืนเหนือระดับสำคัญที่ $3400 ความตึงเครียดด้านภูมิรัฐศาสตร์ที่เพิ่มขึ้นในตะวันออกกลางยังคงกดดันความเชื่อมั่นของตลาด ทำให้เกิดความกังวลเกี่ยวกับความไม่แน่นอนของโลก นอกจากนี้ การคาดว่า Federal Reserve จะลดอัตราดอกเบี้ยในปี 2025 ทำให้ค่าเงินดอลลาร์สหรัฐไม่แข็งค่ามากขึ้น
ในวันศุกร์ คู่สกุลเงิน EUR/USD พลิกกลับเป็นความได้เปรียบของเงินดอลลาร์สหรัฐและยืนอยู่ต่ำกว่าระดับการปรับแก้ Fibonacci ที่ 100.0% ที่ระดับ 1.1574 ซึ่งไม่ได้เกิดขึ้นโดยไม่มีเหตุผลซึ่งเราจะพูดถึงในส่วนล่าง การยืนอยู่ต่ำกว่า 1.1574 เปิดทางให้มีการลดลงอย่างต่อเนื่องไปยังระดับ Fibonacci ถัดไปที่
ลิงก์ที่มีประโยชน์: บทความอื่นๆ ของฉันสามารถอ่านได้ในส่วนนี้ หลักสูตร InstaForex สำหรับผู้เริ่มต้น การวิเคราะห์ยอดนิยม เปิดบัญชีซื้อขาย สำคัญ: ผู้เริ่มต้นในการเทรด Forex ควรระมัดระวังอย่างมากในการตัดสินใจเข้าสู่ตลาด ก่อนการประกาศรายงานที่สำคัญ ควรหลีกเลี่ยงการเข้าเทรดในตลาดเพื่อป้องกันตัวเองจากความผันผวนที่เพิ่มขึ้น ซึ่งจะทำให้เกิดการแกว่งตัวของราคาที่รุนแรง
บนกราฟรายชั่วโมง คู่เงิน GBP/USD เมื่อวันศุกร์ได้ดีดตัวสองครั้งจากระดับ 127.2% ของ Fibonacci retracement ที่ระดับ 1.3527 และปรับตัวขึ้นไปสู่โซนแนวต้านที่ระดับ 1.3611–1.3633 อย่างไรก็ตาม ก่อนหน้านั้น มันได้ดีดตัวจากโซนแนวต้านนี้และลดลงกลับไปที่ระดับ
เมื่อรูปแบบ Bullish 123 ปรากฏขึ้นในท่ามกลางสภาวะการอ่อนตัวของคู่สกุลเงินแปลกใหม่นี้ ซึ่งได้รับการยืนยันโดยการเคลื่อนไหวของราคาคู่เงิน USD/IDR ที่เคลื่อนที่ภายในช่อง Equisidant ที่มีความลาดชันลดลง แต่เมื่อรูปแบบนี้ก่อตัวและช่องทางสำเร็จในการถูกเจาะทะลุ ราคาคู่เงิน USD/IDR ที่ยังคงอยู่เหนือระดับ WMA (21)
ในกราฟ 4 ชั่วโมงของเครื่องมือสินค้าโภคภัณฑ์น้ำมันดิบ มีการปรากฏของ Divergence ระหว่างการเคลื่อนไหวของราคา #CL กับตัวบ่งชี้ Stochastic Oscillator ซึ่งบ่งชี้ว่าในอนาคตอันใกล้อาจมีการแก้ไขที่อ่อนลง โดยระดับ 70.86 จะถูกทดสอบในอนาคตอันใกล้นี้ หากระดับนี้ถูกทำลายและปิดต่ำกว่านั้นได้สำเร็จ
ในช่วงต้นของเซสชันอเมริกัน ยูโรกำลังซื้อขายอยู่ที่ประมาณ 1.1499 ลดลงหลังจากขึ้นไปแตะระดับสูงสุดที่เห็นครั้งสุดท้ายในปี 2021 ที่ประมาณ 1.1630 ควรพิจารณาซื้อคู่เงิน EUR/USD ที่ระดับ 1.1491 เนื่องจากระดับนี้ตรงกับค่า Murray 7/8 และค่า
ทองคำกำลังซื้อขายอยู่ที่ประมาณ 3,420 ในช่วงการซื้อขายของอเมริกา หลังจากที่ได้แตะและผ่านระดับสูงสุดที่เคยเห็นเมื่อเดือนพฤษภาคมราว 3,443 มาแล้ว เมื่อวันที่ 6 พฤษภาคม มีช่องว่างอยู่ที่ประมาณ 3,424 ช่องว่างนี้ได้รับการเติมเต็มในระหว่างช่วงการซื้อขายของยุโรป ซึ่งบ่งชี้ว่าเงินยูโรอาจเกิดการปรับตัวทางเทคนิคอย่างแรงในอีกไม่กี่วันข้างหน้าหากราคาปรับตัวอยู่ต่ำกว่าระดับ 8/8
เมื่อวันพฤหัสบดี คู่สกุลเงิน EUR/USD ยังคงเคลื่อนไหวขึ้นและยืนเหนือระดับ 100.0% Fibonacci retracement ที่ 1.1574 อย่างไรก็ตาม ในช่วงกลางคืนเกิดการกลับอย่างรวดเร็วสนับสนุนเงินดอลลาร์สหรัฐ โดยมีการทะลุระดับนี้ลงมา และขณะนี้กำลังลดลงไปสู่ระดับ Fibonacci ที่
ในกราฟรายชั่วโมง คู่ GBP/USD ในวันพฤหัสบดีปรับตัวขึ้นจากระดับ 1.3520 พุ่งขึ้นไปยังโซนแนวต้านที่ 1.3611–1.3620 กระดอนจากสองครั้งก่อนที่จะลดลงสู่ระดับฟีโบนักชี retracement ที่ 127.2% ที่ 1.3527 การดีดกลับจากระดับนี้อีกครั้งจะสนับสนุนค่าเงินปอนด์และบ่งบอกถึงการเติบโตเพิ่มเติมไปยังระดับ 1.3611–1.3620
สมาชิกInstaForex
Your IP address shows that you are currently located in the USA. If you are a resident of the United States, you are prohibited from using the services of InstaFintech Group including online trading, online transfers, deposit/withdrawal of funds, etc.
If you think you are seeing this message by mistake and your location is not the US, kindly proceed to the website. Otherwise, you must leave the website in order to comply with government restrictions.
Why does your IP address show your location as the USA?
Please confirm whether you are a US resident or not by clicking the relevant button below. If you choose the wrong option, being a US resident, you will not be able to open an account with InstaTrade anyway.
We are sorry for any inconvenience caused by this message.